Predicting socio-economic outcomes with Google Trends

Everybody lies (sometimes).
This is both a universal truth and the title of a book by Seth Stephens-Davidowitz, former data scientist at Google and PhD in economics from Harvard. Everybody lies is an incredibly fun read offering a compelling argument: that our online searches can reveal more about our true selves than we might like to admit. The book is not only a testament to the power of non-traditional data sources, but also an invitation to explore human behaviour through a different lens.
Stephens-Davidowitz's work shows that Google searches can be used to predict a wide range of socio-economic outcomes when conventional data sources are not available or are contaminated by social desirability bias. The latter occurs when people are reluctant to disclose their true preferences or beliefs in surveys, which is particularly important when studying sensitive topics such as racial animus, sexual orientation, or mental health. The idea is quite simple: if revealing what you really think leads to social stigma, then you would be more likely to confess to Google than to a survey interviewer. In a sense, the unfiltered truth of humanity lies in Google's autocomplete bar.
In one of his academic papers published in the Journal of Public Economics, Stephens-Davidowitz uses Google searches to measure racial animus in the U.S. and its impact on the 2008 and 2012 presidential elections – specifically, he finds that racially charged Google search rates are a strong negative predictor of Obama's vote share. The point estimates in the preferred specification suggest that racial animus cost Obama around 4 percentage points in the 2008 election, which is significantly above previous estimates based on survey data.
| Term | Underlying variable | t-Stat | $R^2$ |
|---|---|---|---|
| God | Percent believe in god | 8.45 | 0.65 |
| Gun | Percent own gun | 8.94 | 0.62 |
| African American(s) | Percent Black | 13.15 | 0.78 |
| Hispanic | Percent Hispanic | 8.71 | 0.61 |
| Jewish | Percent Jewish | 17.08 | 0.86 |
Source: Stephens-Davidowitz (2015), Table 1. The t-stat and $R^2$ are from a regression with the normalized search volume of the word(s) in the first column as the independent variable and measures of the value in the second column as the dependent variable. The normalized search volume for all terms is from 2004 to 2007. All data are at the state level.
But the potential of Google searches goes beyond measuring racial animus. In Table 1, I show some of Stephen-Davidowitz's examples on how Google searches can be exploited to predict various population-level outcomes. For example, Google searches for the word "Gun" explain 62% of the variation in states' gun ownership rates, and Google searches for the word "Hispanic" explain 61% of the variation in the percentage of Hispanic population across U.S. states.
Can we do better? In this post, I will show you how we can leverage the popularity of Latin urban music artists in Google searches to predict state-level Hispanic population shares in the U.S.
Some background on Google Trends data
Data on Google searches is available through Google Trends, a tool that allows users to explore the popularity of search terms over time and across different regions within countries. The data is normalized to the time and location of a query, so that the popularity of a search term is measured relative to the total number of searches in a given region and time period. In other words, Google Trends gives measures of relative search term popularity, not an absolute measure of the number of searches for a given term.1 Relative popularity is measured on a scale from 0 to 100, where 100 is the most popular point in time or location for a given search term. For example, value of 50 means that the term is at half its peak observed popularity.
There are a bazillion online resources on how to use Google Trends, so I won't go into the details here. As a starting point, I would recommend you to check out the Google Trends basics page and the search tips page.
Predicting Hispanic population shares with Google Trends
We will combine Google Trends data on the popularity of search terms related to Latin urban music superstars with data on the Hispanic population shares across U.S. states sourced from the American Community Survey (ACS) microdata for the year 2022.2
First, we will use the search term "bad bunny" to predict Hispanic population shares. Bad Bunny is arguably the most popular Latin artist worldwide nowadays – in 2022, he was Billboard's top artist of the year and the most streamed artist in Spotify and Apple Music. He also has a huge following on Instagram with over 40 million followers, and its popularity has played a crucial role in the reivindication of the Latino culture and identity in the U.S. (ahora todos quieren ser latinos).
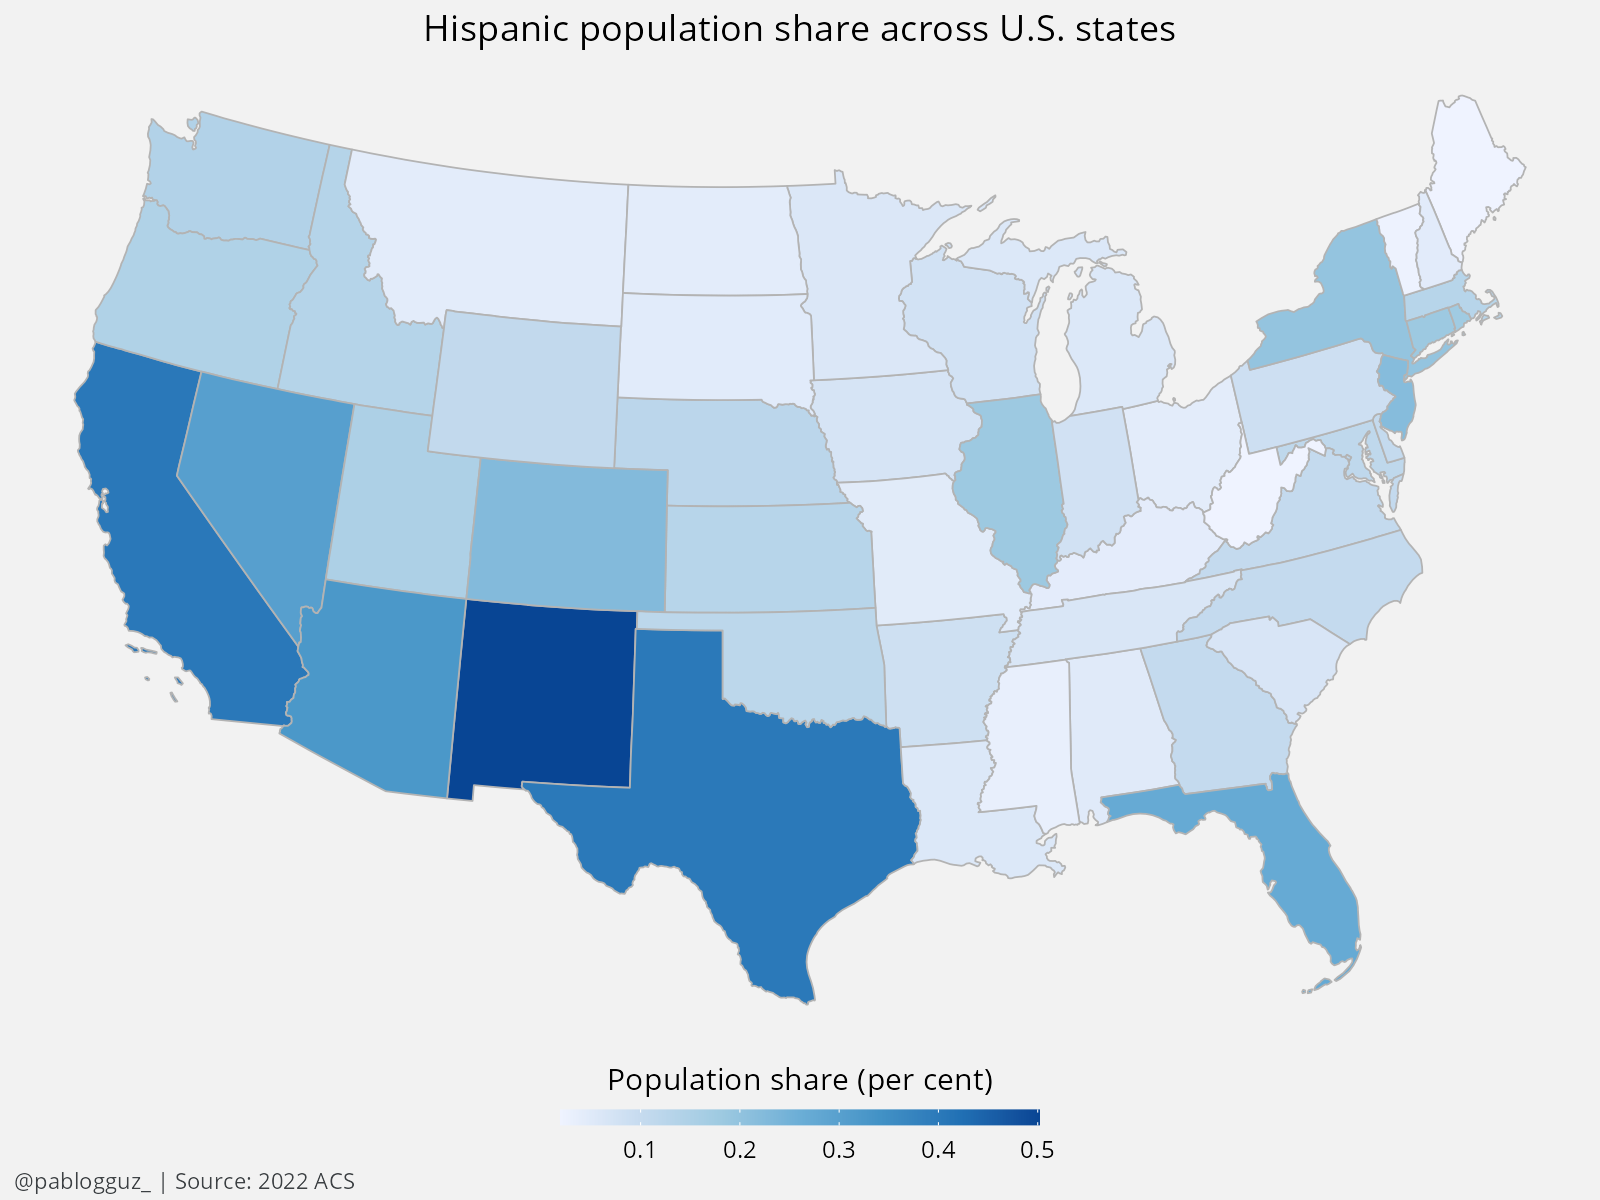
Let's do it. To start with, I show the Hispanic population shares across U.S. states in 2022 in Figure 1. Unsurprisingly, the Hispanic population is concentrated in the South and West regions of the U.S. The states with the highest Hispanic population shares are New Mexico, California, and Texas, with shares of 50%, 40.3%, and 40.2%, respectively. The states with the lowest Hispanic population shares are West Virginia, Maine, and Vermont, with shares of around 2% each.
Now, let's do the same for the popularity of the search term "bad bunny" in the U.S. in 2022:
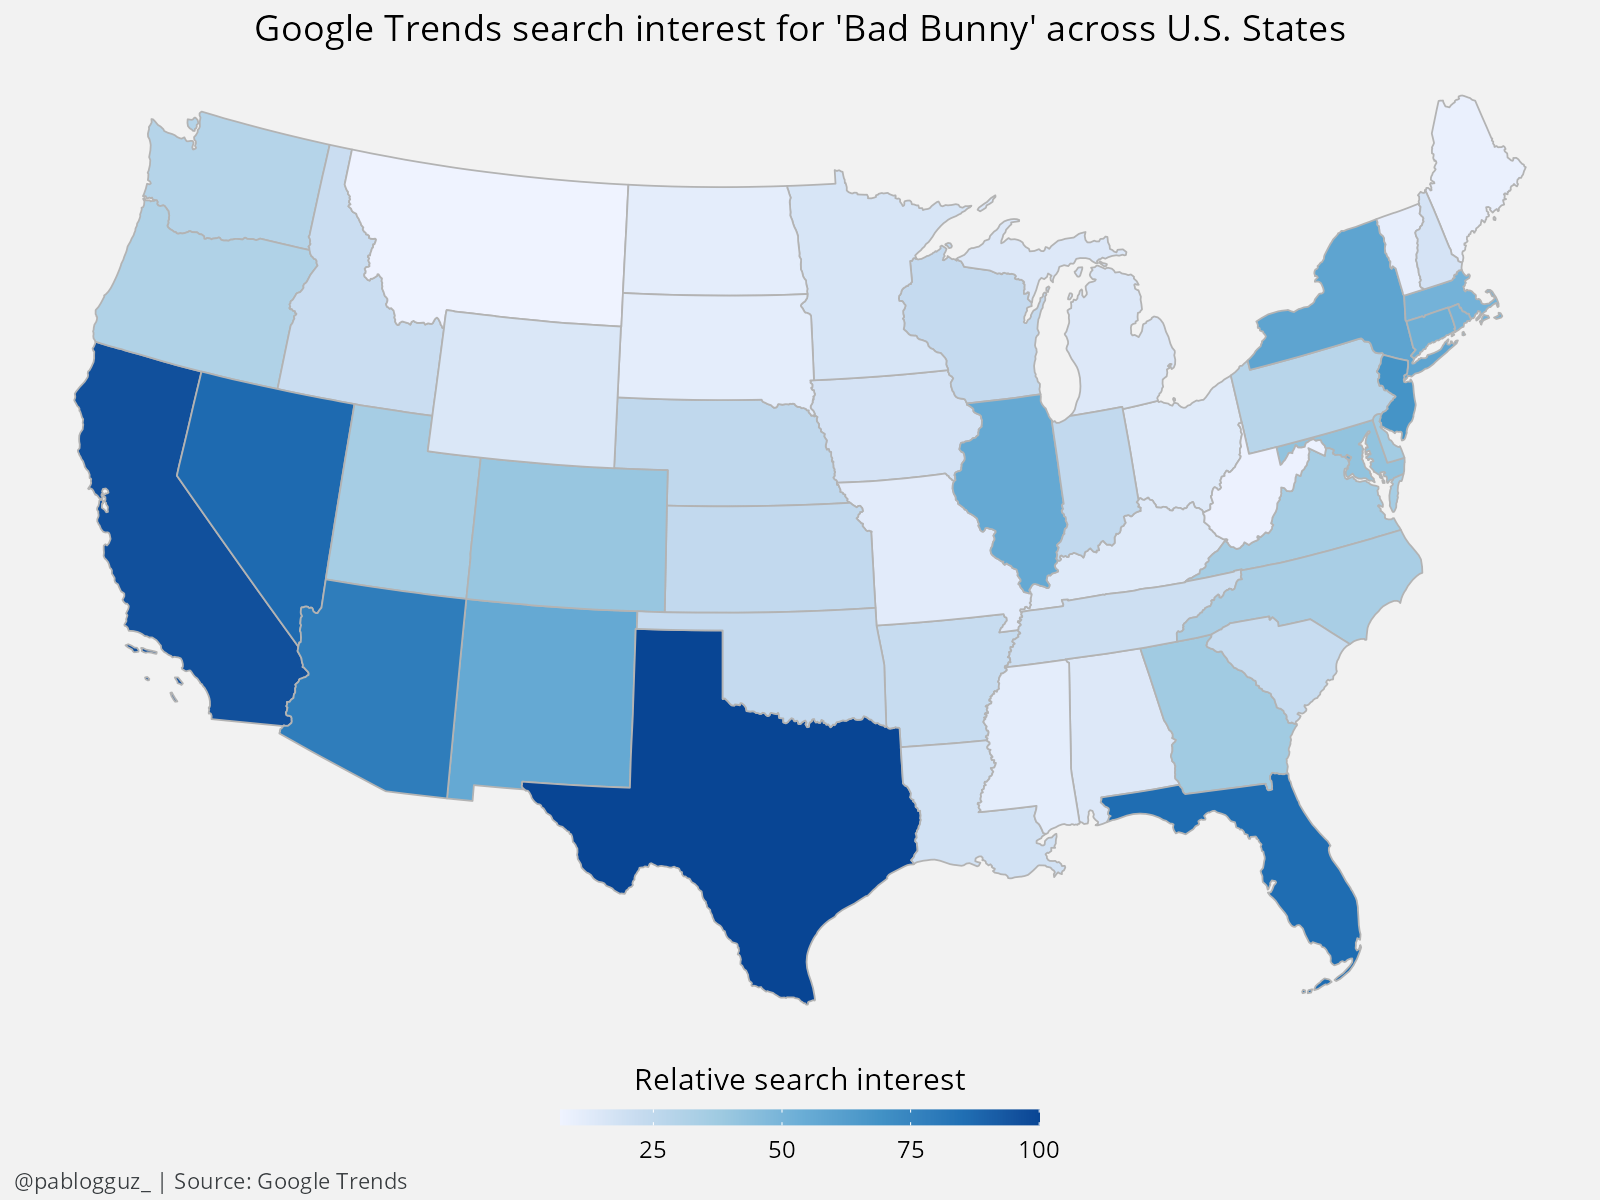
Similar, right?
We can visualize the relationship between the popularity of the search term "bad bunny" and the Hispanic population shares across U.S. states in a scatter plot (see Figure 3). By running a simple OLS regression of the Hispanic population share on the popularity of the search term, we get that 76% of the variation in the Hispanic population share across U.S. states can be explained by the relative popularity of Bad Bunny in Google searches. This implies a 15 percentage point increase in the share of variation explained relative to just using the term "Hispanic" as a predictor.
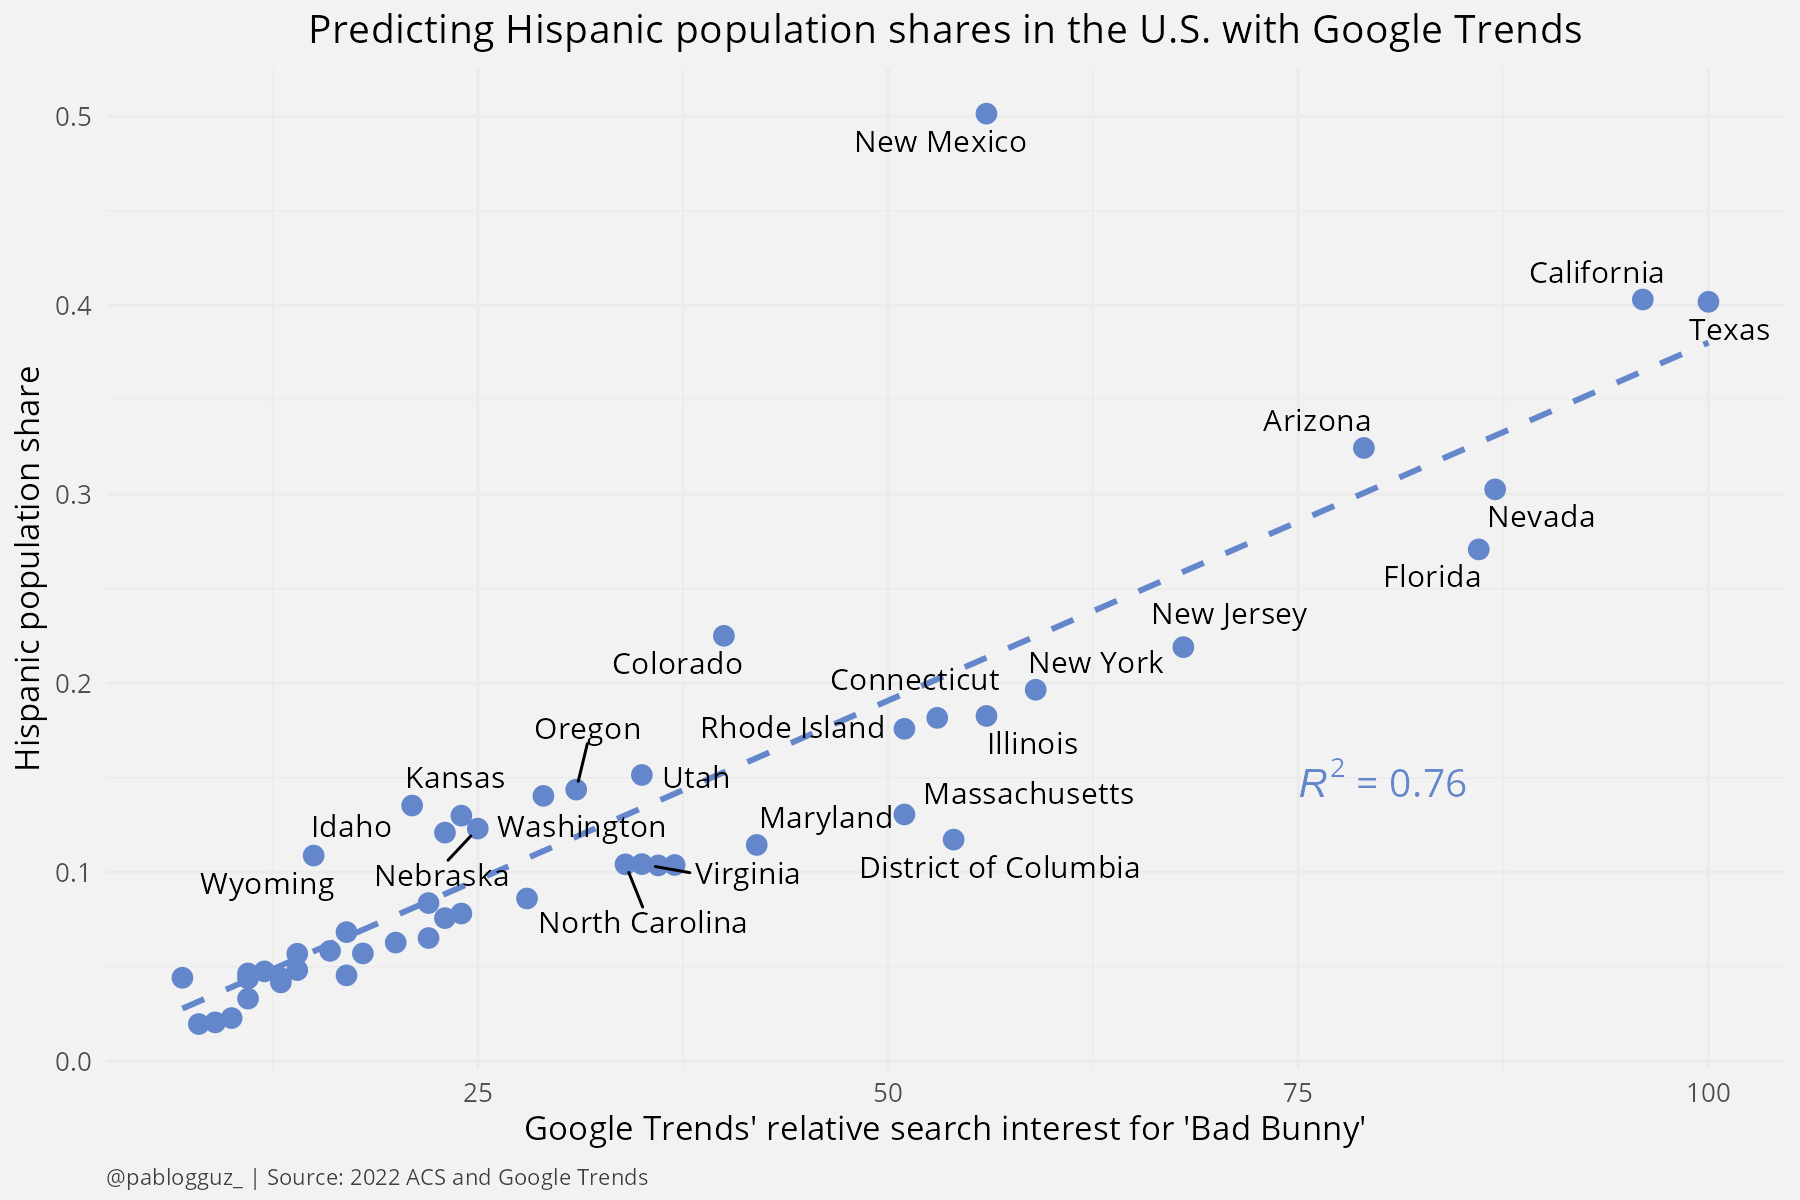
There is one state that is particularly off path: New Mexico (if we were to omit it, then the share of variation explained would go up to 89%). New Mexico has a Hispanic population share of 50%, but the popularity of Bad Bunny in Google searches is only 56% of the most popular point location for the term.
One particularity of New Mexico is that it has the highest population share with Mexican origin in the U.S. What if we focused on the popularity of a Mexican artist, and looked at Mexican population shares instead? I got curious about this, so I replicated the analysis exploiting the popularity of the search term "peso pluma". Peso Pluma is a Mexican artist whose popularity has skyrocketed during the last couple of years, being Youtube's most viewed artist of 2023 in the U.S.
The results are shown in Figure 4. The fit is breathtaking: Peso Pluma's popularity in Google searches explains 94% of the variation in the Mexican population share across U.S. states.

Measuring what matters
Fine, this is cute. But what's the point?
The point is that Google searches can be used to measure things that actually matter. We might not need to predict historical Hispanic population shares, or for that matter any type of socio-economic outcome that can be easily derived from traditional data sources. But we might be interested, for instance, in nowcasting suicide rates or the prevalence of mental health disorders. Insofar as these figures could guide the allocation of resources in healthcare systems and provide early warning signs for potential crises, they could be a quite important estimand for policy.
In Table 2, I illustrate the comparison between how state-level suicide rates in the U.S. correlate with both Google search terms and self-reported measures of suicide risk. While Google searches are not perfect, they prove to be more reliable than the traditional survey-derived data, which yields statistically insignificant correlations.
| Predictor | $r$ | $p$ |
|---|---|---|
| Google search term | ||
| Suicide | -.06 | .63 |
| How to suicide | .49 | < .001 |
| How to kill yourself | .61 | < .001 |
| How to commit suicide | .63 | < .001 |
| Painless suicide | .59 | < .001 |
| Composite of all four suicidal terms | .67 | < .001 |
| Self-report measure | ||
| Suicidal thoughts | -.17 | .22 |
| Suicidal plans | -.14 | .30 |
| Suicidal attempts | -.03 | .82 |
| Composite of self-reported suicidality | -.16 | .25 |
Source: Ma-Kellams et al. (2016), Table 1. Data for 2008 and 2009. The column $r$ shows the correlation between suicidal death rates and the relevant Google search term at the state level. Self-reported measures are sourced from the National Survey on Drug Use and Health.
We can also use Google searches to track economic activity in real time. For example, the OECD has developed a tool that uses Google searches to nowcast GDP growth on a weekly basis. The algorithm gathers data related to various realms of economic activity, using search terms related to consumption (like "vehicles" and "household appliances"), labour market conditions (such as "unemployment benefits"), the housing sector (like "real estate agencies" and "mortgages"), business-related services, industrial activity, trade, and economic sentiment, among others. So, next time you are casually checking (again) whether rent prices are going up in your area, you might be contributing to a fancy economic forecast.
Wrapping up
In this post, I have shown some examples on how Google searches can be used to proxy for a wide range of outcomes when conventional data sources are not available or are contaminated by social desirability bias. This often involves being creative and leveraging pop-culture knowledge – as we saw, Bad Bunny helps us predict Hispanic population shares better than the term "Hispanic" itself.
That said, it does not always work. Using Google Trends for research purposes can be tricky, as most of the time you will lack the granularity needed to link the data to the relevant population. In the U.S., the data is only available at the state and metro area levels, and it is not possible to obtain data for finer geographic areas or specific demographic groups.3 For some countries, the minimum level of aggregation is too coarse to be useful: for instance, the UK's finest administrative boundary in Google Trends corresponds to the region level, which means that you will not have variation within England, Scotland, Wales, or Northern Ireland.
Still, I think it's quite cool. I will leave below a bunch of potential applications for Google Trends data that I would find particularly interesting:
- Sexual minorities: can we use Google searches to estimate sexual minority population shares in settings where sexual orientation and identity are heavily stigmatized? Stephens-Davidowitz has some work on this for the U.S., but I would be curious to see how this could be extended to countries where sexual minorities are criminalized.
- Political outcomes: there has been a rising concern about how polls often underestimate voting intention for far-right parties (for instance, see here). Could we predict vote shares for controversial candidates at scale with Google searches?
- Emergency situations and public safety: during emergencies, real-time data from Google Trends can provide insights into public sentiment or areas of concern, which might be faster or more accurate other methods. For instance, in the context of natural disasters, spikes in searches for emergency services or relief efforts can indicate the most affected areas or the public’s most urgent needs.
I will leave it here. If you have worked with Google Trends data before and have some cool applications in mind you would like to share, please feel free to get in touch!
1 However, with some assumptions and creativity, it is possible to come up with proxies for absolute Google search volumnes. See Appendix C in Stephens-Davidowitz (2015) for more details.
2 I identify people with Hispanic/Latino origin in the ACS using the variable HISPAN. More details can be found here.
3 One further caveat is that the Google Trends metro areas are custom aggregates and do not correspond to standard metropolitan statistical areas (MSAs) or metropolitan divisions. Due to this, there has been some attempts to map Google Trends metro areas to more granular geographic units, such as counties in the U.S.
References
- Stephens-Davidowitz, S. (2017). Everybody lies: Big data, new data, and what the internet can tell us about who we really are. Bloomsbury Publishing.
- Stephens-Davidowitz, S. (2015). The cost of racial animus on a black candidate: Evidence using Google search data. Journal of Public Economics, 118, 26-40.
- Ma-Kellams, C., Or, F., Baek, J. H., & Kawachi, I. (2016). Rethinking suicide surveillance: Google search data and self-reported suicidality differentially estimate completed suicide risk. Clinical Psychological Science, 4(3), 480-484.