A demographic projection of Spain's native-born population: quantifying the stock of second-generation immigrants

Introduction
Spain's demographic structure is changing — and fast. In 1998, the stock of foreign-born residents was just 2.9% of the total population. By 2024, this figure had skyrocketed to 18.2%, with nearly one in five residents born outside Spain. Among the prime working-age population (ages 25-54), the share of foreign-born individuals has reached 26.8% nationally, and in provinces hosting major urban and economic centers (like Madrid or Barcelona) it is as high as ~35%. That is more than one in three people! 1
This demographic shift extends beyond the first generation of migrants. The children of immigrants — often referred to as "second-generation immigrants" or, more precisely, native-born individuals with foreign-born parents — represent an increasingly important demographic group whose size and characteristics will shape Spain's social and economic landscape in the coming decades.
Unfortunately, there is no readily available data on the number of second-generation immigrants over time in Spain. To bridge this gap, in this post I present a methodological framework for projecting the share of native-born individuals with foreign-born mothers across Spanish provinces from 2024 to 2039. To the best of my knowledge, this is the first attempt to estimate and project the size of this population group into the future. The methodology integrates multiple data sources from Spain's National Statistical Office (Instituto Nacional de Estadística, hereafter INE) and employs simple, fully-reproducible modeling techniques to produce province-level projections of this increasingly important population segment.
Data
The projection methodology I propose draws on multiple datasets. All data is publicly available and can be accessed through INE's website:
- Population projections (2024-2039): This is the backbone of the analysis. The projections (elaborated by INE) provide estimates of Spain's future population broken down by basic demographic characteristics following cohort component methods, which are the international standard for population projections. The projections also include mortality indicators, which will be used to estimate survival probabilities for each age group. All the projections used in the analysis correspond to the "central" (baseline) scenario. One way to think about this baseline scenario is as a "business as usual" projection, which assumes that current demographic trends (birth rates, death rates, and migration patterns) will continue into the future along their present trajectory.
- Birth statistics: The births microdata allows me to establish the baseline proportion of births to foreign-born mothers in each province and provides historical data for modeling the relationship between foreign-born female population and births to foreign-born mothers.
- Survey on Essential Characteristics of Population and Housing (ECEPOV-2021): This household survey, conducted by INE in 2021, complements the 2021 census by providing information not available in administrative registers — in particular, the ECEPOV-2021 will allow me to calculate the existing share of native-born individuals with foreign-born mothers by age and province in 2021. This will provide the baseline structure for the projections.
Methodology
The fundamentals
Let's start with the basics. The classic equation that demographers use to track population changes (in its discrete form) is quite simple:
$$N_{t+1} = N_t + B_t - D_t + I_t - E_t$$
where $N_t$ is the population at time $t$, $B_t$ is births, $D_t$ is deaths, $I_t$ is immigration, and $E_t$ is emigration. This equation captures the fundamental flows that shape population: we start with last year's population, add new births, subtract deaths, and account for people moving in and out.
Let me now write down a slightly more refined version of the equation above that accounts for age structure:
$$N(a+1,t+1) = N(a,t) \times s(a,t) + M(a,t)$$
Here, $N(a,t)$ represents the population of age $a$ at time $t$, while $s(a,t)$ is the survival probability (the chance someone of age $a$ survives to age $a+1$), and $M(a,t)$ captures net migration (immigration minus emigration) of that particular age group. For example, to find next year's 30-year-olds, take this year's 29-year-olds, calculate how many will survive to age 30, and add any net migration of 30-year-olds.
Now, we're specifically interested in the stock of second-generation immigrants. For simplicity, I will define this group as native-born individuals with foreign-born mothers (hereafter NBF). We can then decompose the total population into three mutually exclusive groups:
$$N(a,t) = NBF(a,t) + NBNM(a,t) + FB(a,t)$$
where:
- $NBF(a,t)$ is the native-born population with foreign-born mothers
- $NBNM(a,t)$ is the native-born population with native-born mothers
- $FB(a,t)$ is the foreign-born population
Each component follows the same demographic principles but differs in how new members enter the population:
| Population group | Change equation | Newborns |
|---|---|---|
| Native-born with foreign-born mothers (NBF) | $NBF(a+1,t+1) = NBF(a,t) \times s(a,t) + M_{NBF}(a,t)$ | $NBF(0,t+1) = B(t) \times s_{infant}(p,t) \times \Phi_{FB}(t) + M_{NBF}(0,t)$ |
| Native-born with native-born mothers (NBNM) | $NBNM(a+1,t+1) = NBNM(a,t) \times s(a,t) + M_{NBNM}(a,t)$ | $NBNM(0,t+1) = B(t) \times s_{infant}(p,t) \times (1 - \Phi_{FB}(t)) + M_{NBNM}(0,t)$ |
| Foreign-born population (FB) | $FB(a+1,t+1) = FB(a,t) \times s(a,t) + M_{FB}(a,t)$ | $FB(0,t+1) = M_{FB}(0,t)$ |
In the table above, $\Phi_{FB}(t)$ is the share of births to foreign-born mothers in year $t$, and $M_{NBF}(a,t)$, $M_{NBNM}(a,t)$, and $M_{FB}(a,t)$ are the migration flows for each population group.
Notice that $s_{infant}(p,t) \neq s(p,0,t)$. The intuition is the following. Demographic projections typically reference population stocks as of January 1st of each year, which means that the age 0 population at time $t+1$ consists of children born during year $t$ who survived to January 1st. Since births occur throughout year $t$, newborns are exposed to mortality risk for only part of the year on average. To account for this partial-year exposure, I use an adjusted infant survival probability that differs from standard age-specific survival rates:
$$s_{infant}(p,t) = 1 - 0.5 \times m(0,p,t)$$
where $m(0,p,t)$ is the mortality rate for age 0 in province $p$ during year $t$. The 0.5 multiplier reflects that, on average, newborns are exposed to mortality risk for approximately half a year before reaching the January 1st reference date.
Modeling births to foreign-born mothers
To project future demographic patterns accurately, we need some assumption(s) on how the proportion of births to foreign-born mothers will evolve over time. In particular, this key parameter isn't static but fluctuates in response to changes in the foreign-born female population. One simple way to think about it is using a linear regression model that links the share of foreign-born women in a province to the percentage of births to foreign-born mothers in that same province:
$$\Phi_{FB}(p,t) = \alpha_p + \beta \times \frac{\text{Foreign-born females} (p,t)}{\text{Total females} (p,t)} + \varepsilon_{p,t}$$
where:
- $\Phi_{FB}(p,t)$ is the share of births to foreign-born mothers in province $p$ at time $t$
- $\alpha_p$ represents province fixed effects
- $\beta$ is a global elasticity coefficient
- $\frac{\text{Foreign-born females} (p,t)}{\text{Total females} (p,t)}$ is the proportion of women in province $p$ at time $t$ who were born abroad.
I estimate the equation above using data from 2009 to 2023, and then apply the estimated coefficients to projected foreign-born population shares through 2039. In the out-of-sample exercise, the number of foreign-born females is calibrated to match the ratio of overall foreign-born population to the total population in each province and year. That is:
$$\frac{\text{Foreign-born females} (p,t)}{\text{Total females} (p,t)} = \frac{\text{Foreign-born population} (p,t)}{\text{Total population} (p,t)} = \gamma(p,t)$$
Ideally, one would use the foreign-born share among the female population of childbearing age (15-49) instead of the overall share of foreign-born women, but unfortunately INE's projections do not provide this breakdown (which makes the out-of-sample prediction exercise unfeasible unless otherwise estimated). For simplicity, I use the overall share as a proxy.
A basic births-and-deaths projection model
Let's abstract from migration for a second. Under a pure births-and-deaths framework, or each province $p$ and year $t$, the population of age $a$ in year $t+1$ is given by:
$$\hat{N}(p,a,t+1) = \underbrace{\hat{N}(p,a-1,t) \times s(p,a-1,t)}_{\text{Aging and survival of last year's population}}$$
Similarly, for the native-born population with foreign-born mothers and native-born population with native-born mothers:
$$\widehat{NBF}(p,a,t+1) = \underbrace{\widehat{NBF}(p,a-1,t) \times s(p,a-1,t)}_{\text{Aging and survival of last year's NBF population}}$$
$$\widehat{NBNM}(p,a,t+1) = \underbrace{\widehat{NBNM}(p,a-1,t) \times s(p,a-1,t)}_{\text{Aging and survival of last year's NBNM population}}$$
And for newborns:
$$\widehat{NBF}(p,0,t+1) = B(p,t) \times s_{infant}(p,t) \times \widehat{\Phi_{FB}}(p,t)$$
$$\widehat{NBNM}(p,0,t+1) = B(p,t) \times s_{infant}(p,t) \times (1-\widehat{\Phi_{FB}}(p,t))$$
where $\widehat{\Phi_{FB}}(p,t)$ is estimated using the predicted values from the regression model:
$$\widehat{\Phi_{FB}}(p,t)= \widehat{\alpha_p} + \widehat{\beta} \times \gamma(p,t)$$
Estimating the initial stock of NBF and NBNM individuals
At the start of the projection, we need the counts of NBF and NBNM individuals by age and province — a level of detail INE does not publish. To establish a coherent baseline, I draw on ECEPOV 2021-microdata and proceed as follows.
First, I classify every repsondent in the ECEPOV-2021 sample into one of three groups: (1) native-born individuals with a foreign-born mother (NBF), (2) native-born individuals with a native-born mother (NBNM), and (3) foreign-born individuals (FB). For all individuals born in Spain with unknown maternal birthplace, I follow a deliberatively conservative approach and classify them as having native-born mothers to avoid overestimating the size of the NBF group. Thus, the results presented here should be interpreted as a lower bound on the number of second-generation immigrants.
Now, remember that the goal is to produce population counts as of January 1 each year, but the fieldwork for ECEPOV was conducted in mid-2021. To simplify things, I treat the survey snapshot as if it were taken on January 1, 2022, and then project forward two full years of births and deaths to reach January 1, 2024 using the model described above. This generates preliminary age $\times$ province estimates for each subgroup of interest (NBF and NBNM), reflecting how populations would have evolved absent migration.
Second, because INE only reports the total population by age and province (including foreign‑born) — denoted $N^{INE}(p,a,2024)$ — I allocate that total across our three groups in the exact proportions implied by the ECEPOV projection. In practice:
$$NBF(p,a,2024) = \frac{\widehat NBF^{ECEPOV}(p,a,2024)}{\widehat N^{ECEPOV}(p,a,2024)} \times N^{INE}(p,a,2024)$$
and similarly for NBNM. Essentially, this rescaling preserves the relative proportions from the survey estimates.
Since the total number of NBF and NBNM individuals in each age $\times$ province cell at baseline are now defined, we have all the necessary data to project both populations forward. However, it is important to note that at every intermediate at every step of the projection — both in establishing the baseline and in year-to-year changes — the absolute numbers of NBF and NBNM individuals remain misaligned with INE's official native-born population totals. This stems from two factors: (1) small differences between the native-born population shares in the ECEPOV survey and the true native-born shares in the population in 2021, and (2) the fact that the births-and-deaths projections model abstracts from migration flows. To correct for this, in the next step I re-anchor NBF and NBNM sums to INE’s native-born margins in every province and year using a scaling factor that absorbs any aggregate bias in absolute levels. Intuitively, what persists into the projection is the within-native age $\times$ province ratio of NBF to NBNM individuals, which becomes the true driver of the second-generation relative shares.
Handling migration
We have established a basic births-and-deaths projection framework and calibrated the initial stock of NBF and NBNM individuals, which means we have all the necessary data to project both populations forward. But how do we incorporate migration? Rather than attempting to estimate $M_{NBF}(a,t)$ and $M_{NBNM}(a,t)$ directly, I simply assume that net migration inside the native-born block is allocated in proportion to pre-migration shares within each province. In other words, if the NBF population is 25% of the native-born population in a province before accounting for migration, I assume it will remain 25% after migration. To formalize this intuition mathematically, consider the following derivation.
Let
- $\hat{N}(p,t)$ – birth-and-death projection for the total population (no migration)
- $N^{INE}(p,t)$ – INE's official projection for the total population (includes migration)
- $\widehat{Native}(p,t)$ – birth-and-death projection for native-born population (no migration)
- $Native^{INE}(p,t)$ – INE's official projection for native-born population (includes migration)
- $\widehat{NBF}(p,t)$ – birth-and-death projection for the NBF population
- $NBF(p,t)$ – true, unknown NBF stock we want
Using INE's projections for native and foreign-born populations, I calculate the net migration for the native-born population for each province and year:
$$M_{Native}(p,t) = Native^{INE}(p,t) - \widehat{Native}(p,t)$$
Within the native-born population, I assume that net migration is split in proportion to each subgroup's share:
$$\frac{M_{NBF}(p,t)}{M_{Native}(p,t)} = \frac{\widehat{NBF}(p,t)}{\widehat{Native}(p,t)}$$
This can be rearranged to:
$$M_{NBF}(p,t) = M_{Native}(p,t) \times \frac{\widehat{NBF}(p,t)}{\widehat{Native}(p,t)}$$
Therefore:
$$NBF(p,t) = \widehat{NBF}(p,t) + M_{NBF}(p,t)$$ $$NBF(p,t) = \widehat{NBF}(p,t) \left(1 + \frac{M_{Native}(p,t)}{\widehat{Native}(p,t)}\right)$$ $$NBF(p,t) = \widehat{NBF}(p,t) \frac{Native^{INE}(p,t)}{\widehat{Native}(p,t)}$$
Define a province-specific scaling factor for natives:
$$\lambda_{Native}(p,t) = \frac{Native^{INE}(p,t)}{\widehat{Native}(p,t)}$$
To get the final NBF population, we can then simply multiply:
$$\boxed{NBF(p,t) = \widehat{NBF}(p,t) \times \lambda_{Native}(p,t)}$$
By anchoring in this way at each projection step, I eliminate any level distortions arising both from the initial two-year projection of ECEPOV-derived shares to the January 1 2024 baseline and from each subsequent year-to-year update, and ensure the NBF and NBNM totals match the native-born population from INE's official projections.
Results
The results for the whole country are shown in Figure 1. The share of native-born individuals with native-born mothers will decrease from 77.1% in 2024 to just 62.3% by 2039. In just 15 years, the traditionally dominant demographic group will lose around 15 percentage points of its population. Meanwhile, first-generation immigrants will surge from 18.1% to 28.6% of the population, while second-generation immigrants (native-born with foreign-born mothers) will grow from 4.8% to 9.1%.
Put these numbers together, and you get a striking conclusion: by 2039, nearly 4 in 10 Spanish residents will be either immigrants themselves or the children of immigrants. This represents one of the most rapid demographic transformations in modern European history.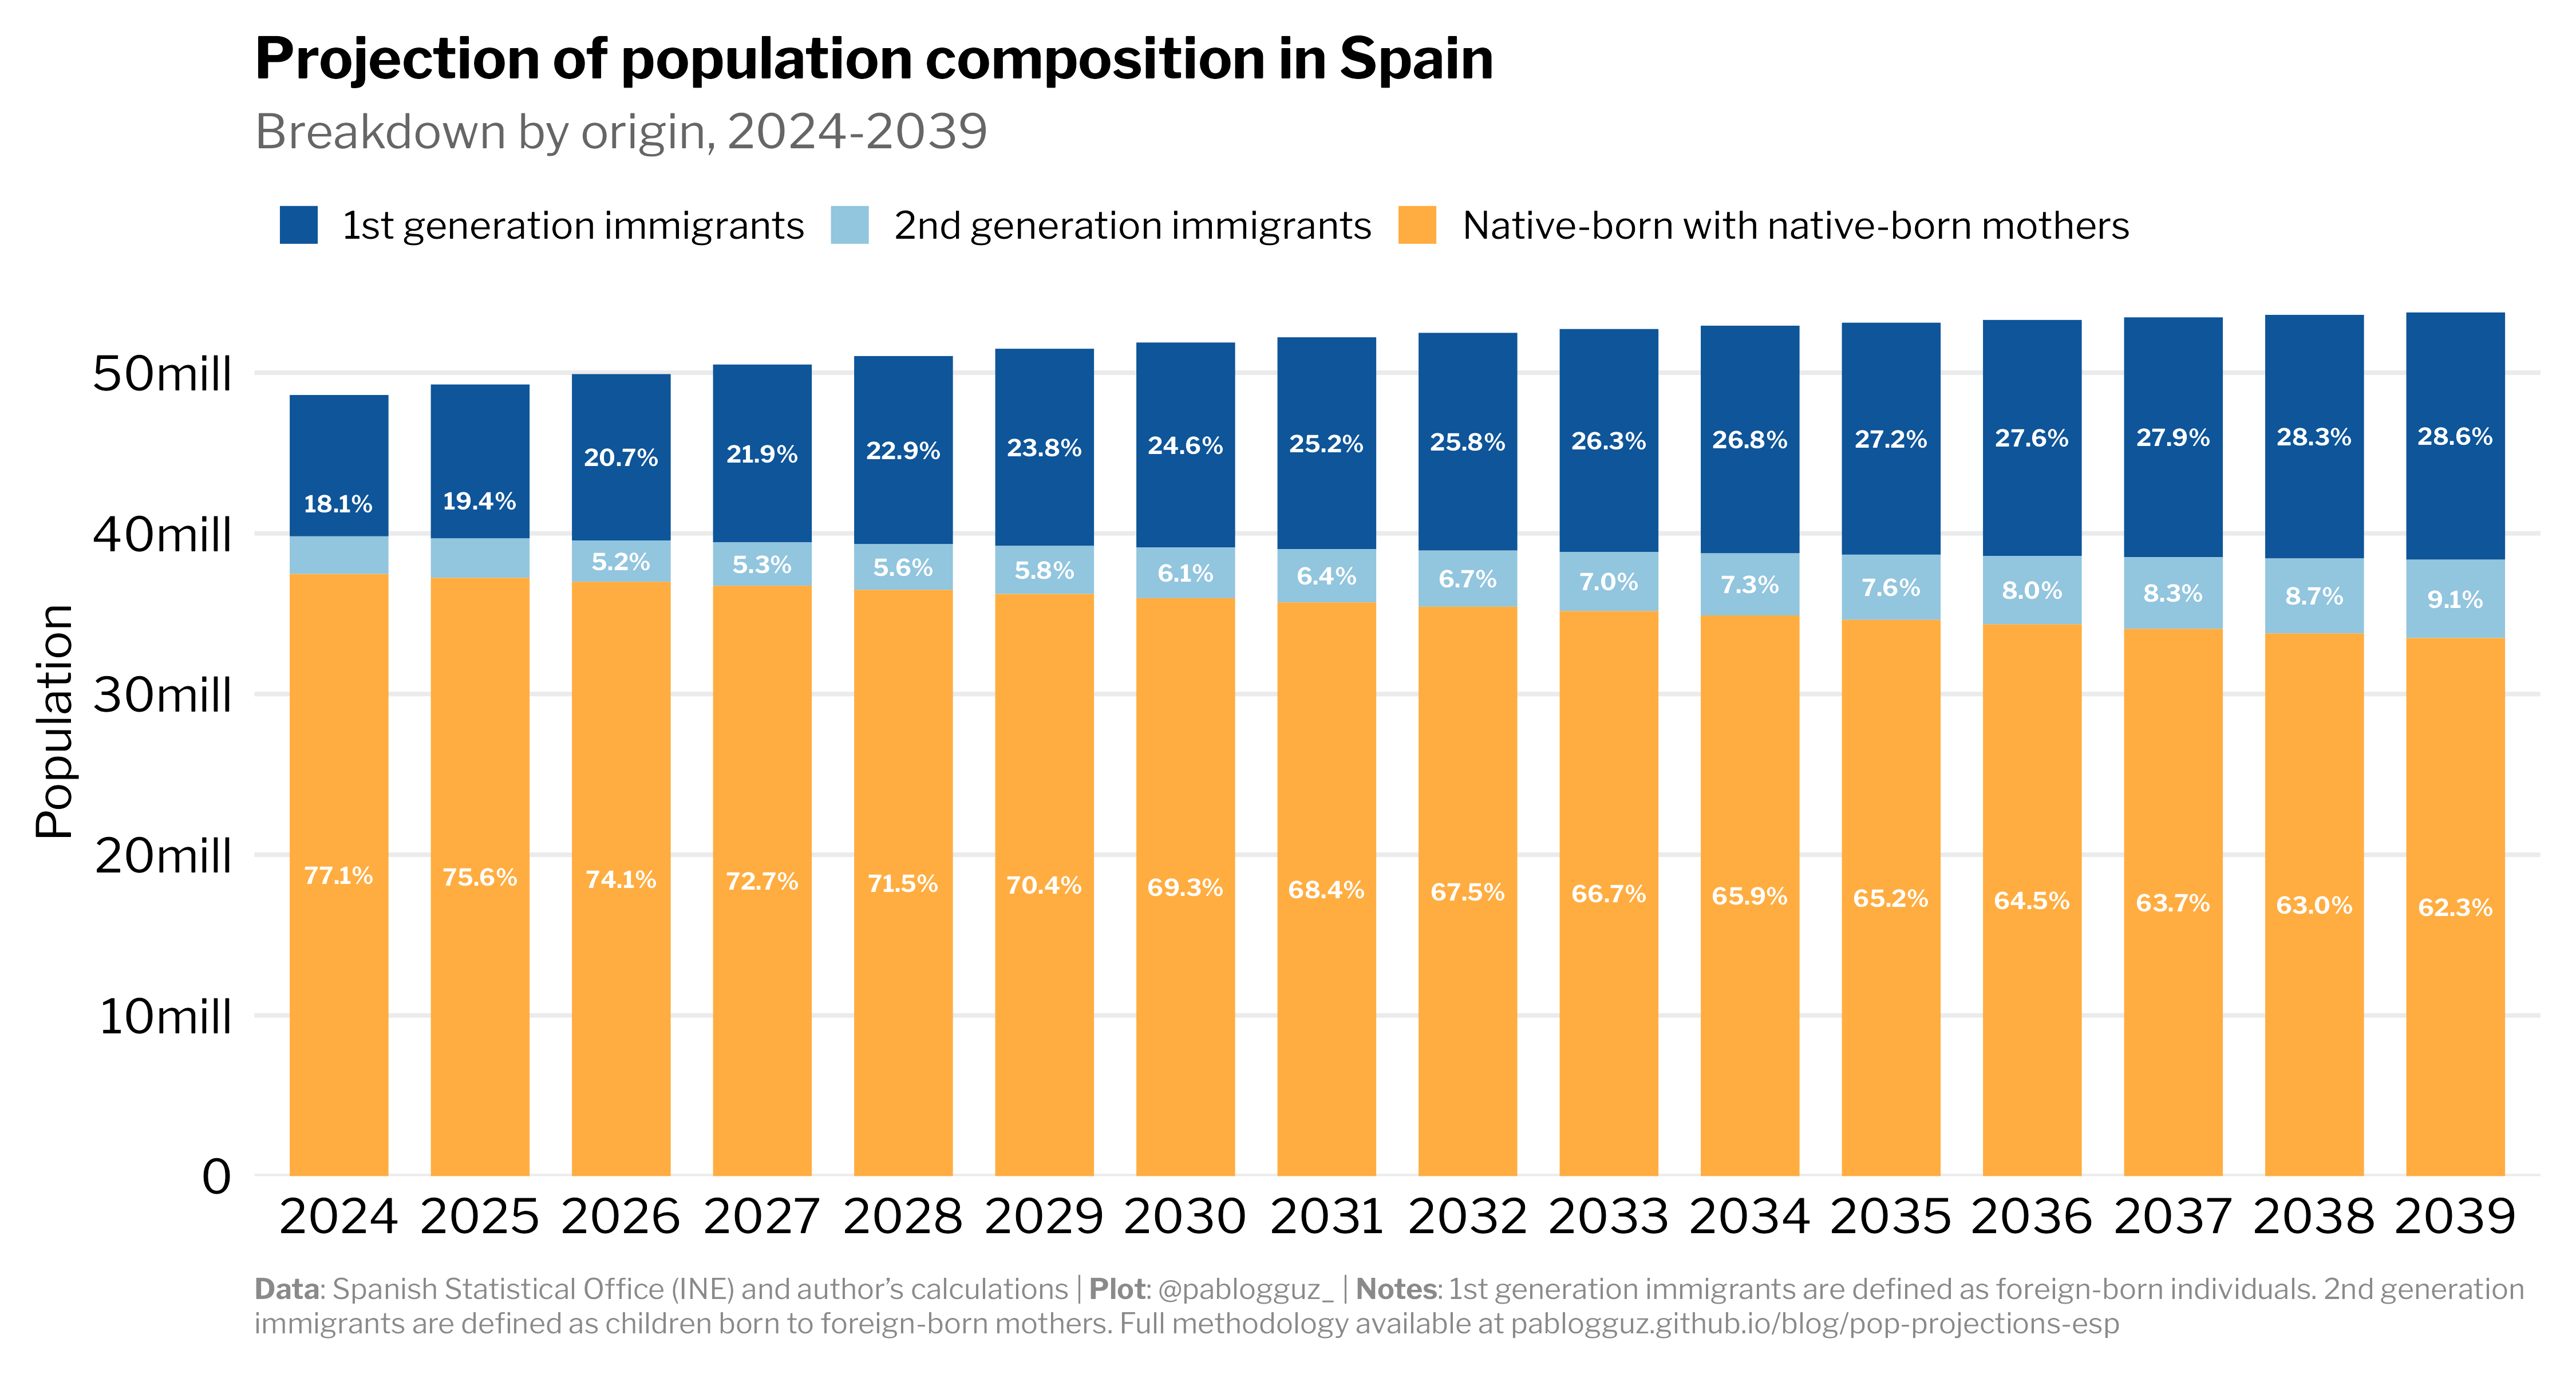
However, the national picture masks a profound regional divergence. As Figure 2 reveals, Spain will fracture into two distinct demographic realities.
In Southern provinces like Córdoba, Jaén, and Badajoz — areas with traditionally agrarian economies and fewer economic opportunities — the demographic composition will remain relatively stable. Here, native-born individuals with native-born mothers will still comprise close to 90% of the population by 2039, preserving much of the traditional demographic character. But along the Mediterranean coast and in economic powerhouses like Madrid and Barcelona, a dramatically different Spain is emerging: in these regions, immigrant and second-generation populations combined will approach or even exceed 50% of the total population by 2039.
In Spain's most economically vital and populous areas, the native-origin population will be close to becoming a minority in less than 15 years. Absent any major shifts in migration patterns, the municipalities of Madrid and Barcelona will transform into multicultural hubs more reminiscent of London or New York than the Spain of previous generations.2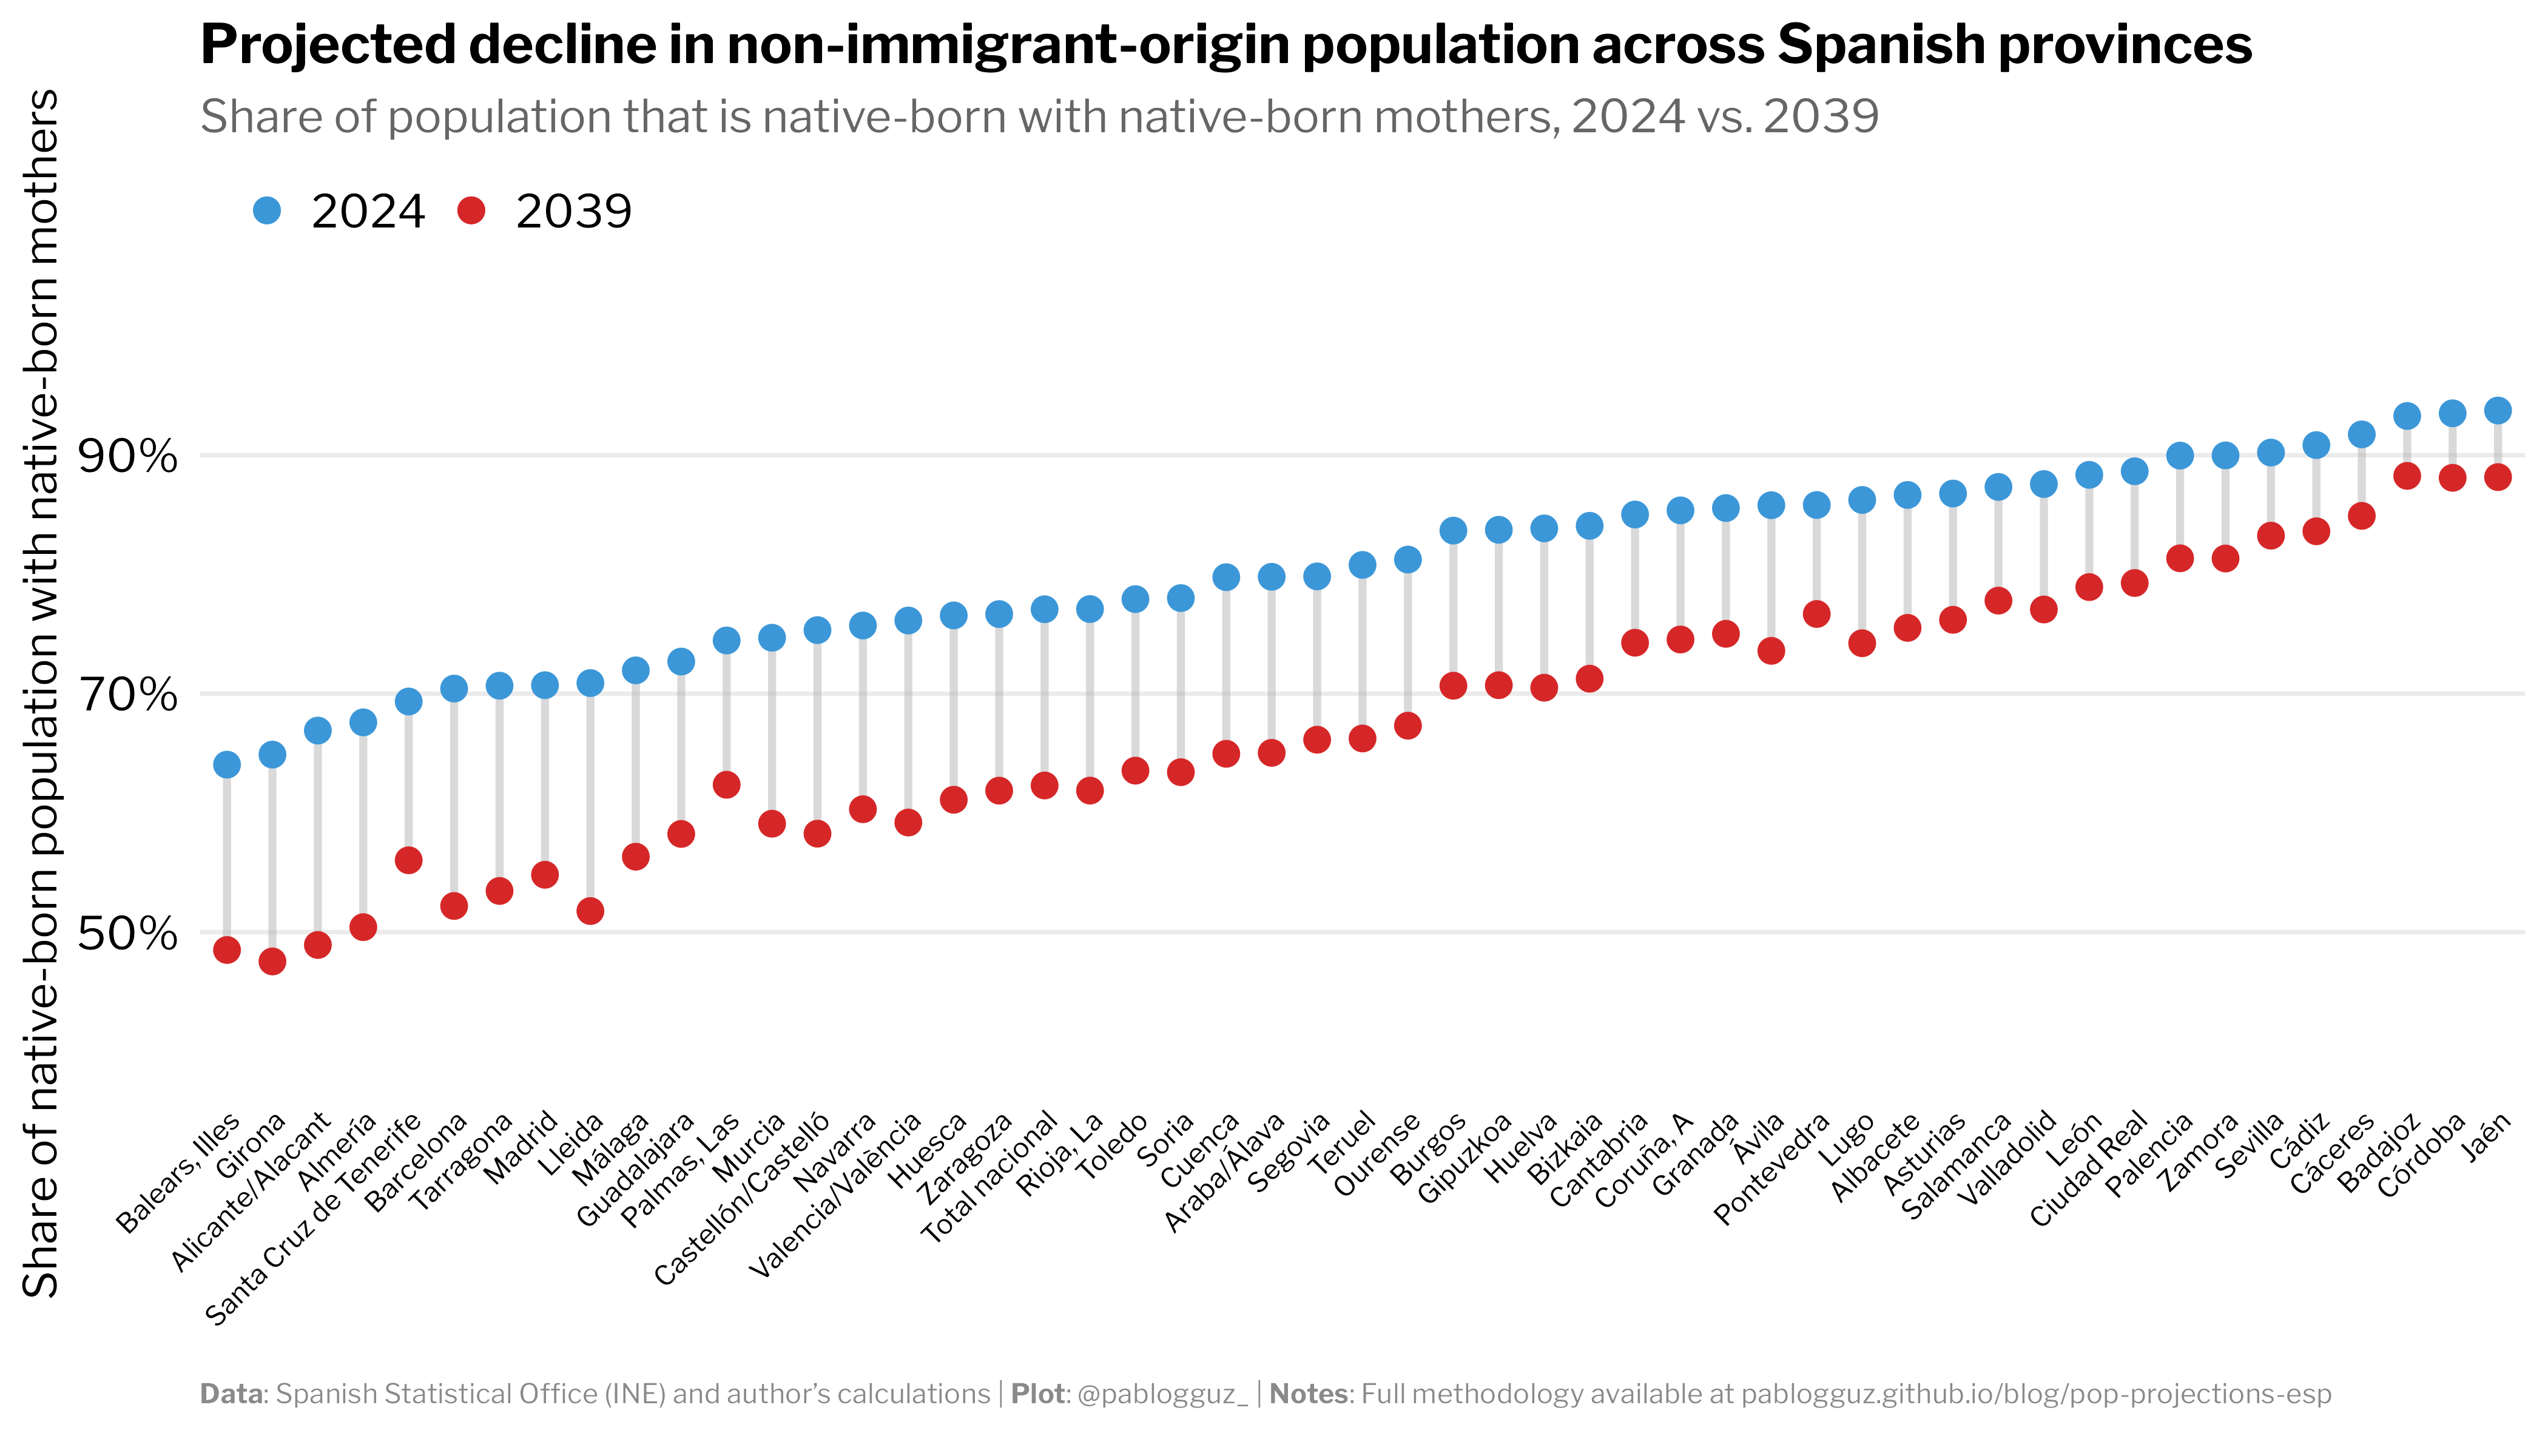
The scale of this shift becomes even more striking when we consider the age distribution. By 2039, the immigrant-origin population (first and second generation combined) will be substantially overrepresented among Spain's working-age population, while the native-origin population will be disproportionately concentrated among older age groups.
We can do a simple back-of-the-envelope calculation to illustrate this point. In 2024, foreign-born individuals constituted 23.1% of Spain's working-age population (ages 15-64), despite representing only 18.2% of the total population—an overrepresentation factor of 1.27. Projecting this pattern forward, by 2039, foreign-born individuals will comprise approximately 36.3% of Spain's working-age population (28.6% $\times$ 1.27).
Among the remaining native-born segment (63.7% of the working-age population), second-generation immigrants will represent about 10.3%, translating to 6.6% of the total working-age population. When combined, these figures imply that, by 2039, approximately 43% of Spain's workforce — over one in four working-age individuals — will be either first or second-generation immigrants.
Some external validation
At this point, you might be wondering how well these projections align with other estimates available and whether they are reasonable at all.
While it is tricky to validate the long-term projections against other estimates since the latter are simply not available (or at least I am not aware of any of them), we can still cross-check the estimates at the 2024 baseline against historical data. In particular, since 2021, Eurostat has been publishing data on population totals for different segments of the working-age population by migration group (see here). In 2024, Eurostat reports that native-born individuals with at least one foreign-born parent (they don’t break out figures for foreign-born mothers alone) constitute 3.80% of Spain's working-age population. To be extremely tedious, I recalculated my projections using the same definition — either parent foreign-born rather than just mothers — and obtained 3.75% for the same year. This is a difference of only 0.05 percentage points relative to official counts, which is well within the margin of error.
Conclusion
What we're witnessing in Spain is nothing short of a demographic revolution. In just over 40 years (1998-2039), Spain will have transformed from a country where foreign-born residents were a tiny minority (2.9%) to one where nearly 40% of residents will be either immigrants themselves or their children.
One cannot help but wonder about the broader implications of such a dramatic shift -- the social reality these projections predict will inevitably reshape Spanish society. How will regional identities evolve when the composition of the population changes so fundamentally? What will happen, for instance, to regional languages like Catalan or Basque, which have historically been maintained through intergenerational transmission among native populations? And what happens when different regions within the same country experience such divergent demographic trajectories?
These are empirical questions that only time will answer, but history suggests that rapid demographic changes often precede significant social and political realignments. Spain, in this sense, may serve as an important case study for other European nations in the coming decades.
If you are curious, I developed an interactive visualization tool to explore data on the international migrant stock in Spain since 1998 to the present using microdata from administrative municipal registers and censuses. Check it out: http://dedonde.es/.
With the caveat that, compared to London or New York, origin countries are much more concentrated in Spanish cities. For example, individuals born in Latin America accounted for roughly 48% of the total foreign-born population stock at the national level in 2024.