A modern IDE for Stata with VSCode + Quarto
Update Aug 2024
I only used this setup for a couple of weeks before switching to a non-interactive integration that allows for running
.dofiles within VSCode. The lack of a data browser and the variable explorer in the Jupyter kernel was a dealbreaker for me (plus I have grown to find interactive notebooks a bit annoying except for very specific tasks). To set this up, follow the instructions here under the "way one" section.Moreover, I have increasingly found myself using R for most of my work over the last year, and I have to stay that I no longer agree with some of the points I made in this post. Most of the time, the so-claimed "superiority" of Stata for reduced-form empirical work is just a skill issue. My advice would be to invest time in mastering R or Python, and then decide whether you really need to use Stata (you probably won't).

Over the last few decades, applied microeconomic research has witnessed what is widely termed as the credibility revolution, a paradigm shift that emphasized the importance of experimental and quasi-experimental methods to credibly identify causal relationships between variables. This transformative period has not only influenced the methodologies employed in academic papers but also strengthened the field's impact on policy-making, by providing more solid and rigorous evidence upon which to base decisions.
This emphasis on methodologically robust empirical approaches has resulted in bigger, more complex projects, naturally elevating the importance of data skills within the field. However, despite the increasing importance of coding in economics, many economists lag in adopting modern coding practices and development environments. One of the most widely used tools in the profession, Stata, is not even a programming language but a purpose-built statistical package.1 Stata is also commercial software, meaning that it does not have the benefits of open-source languages like Python or R, which have amassed extensive communities contributing to their development and offering support. Due to its nature, it has traditionally been hard to integrate Stata with modern IDEs, resulting in a less efficient workflow when one has to write code in multiple languages or use the latest tools for version control, code completion, and so on.
This post provides a quick tutorial on setting up a modern development environment for Stata with Visual Studio Code and Quarto. It is by no means perfect and it comes with its own caveats, but it is a step in the right direction for those who want to modernize a bit their workflow without having to give up on Stata.
Why Stata
I know what you are thinking.
jUsT dOn't usE sTAta BrO.
I get it. I code in multiple languages and it is indeed not a good idea to only use Stata, simply because there are lots of cool things (web scraping, geospatial stuff, ML) that you would miss out on by doing so.
However, the truth is that if you do applied microeconomics for a living, it would be very stupid not to use Stata sometimes. Whoever tells you otherwise is i) not an applied microeconomist (good for them!) or ii) underestimating how important Stata is in the profession:
Stata can be found in more than 70% of replication packages for published papers in economics. It is followed by Matlab (which we deliberately ignore since it is aimed at structural work), and R comes in third with less than 10%. I am not going to argue whether this is a good or a bad equilibrium but it is an equilibrium, and if you want collaborate with others and be able to replicate their work, you will have to use Stata
For reduced-form econometrics, Stata is unparalleled. Period. I have been writing code for +3.5 years and it still amazes me how ridiculously cumbersome R and Python can be relative to Stata when it comes to running regressions. For some specifications, it is simply not possible to use something else unless you want to code the estimator from scratch (good luck running modern difference-in-differences estimators for heterogeneous treatment effects in Python, for example)
Economists love regression tables. And again, the functionalities and flexibility of
esttabto export fully formatted and reproducible LaTeX tables in Stata are light years ahead of the alternatives in other languages (e.g.,stargazerin R)For most people doing applied micro research or policy work, coding will hardly ever be their comparative advantage. Instead, your value lies in the quality of your ideas and how well you execute them – coding is only useful insofar as it helps in that purpose. Some folks (myself included) enjoy venturing off the beaten path, but most researchers would prioritize research productivity if the marginal cost of learning new data skills is sufficiently high. In this sense, Stata has a quite shallow and gentle learning curve, so usually people learn it as their first "language" and then just stick to it. I am not saying this is good (I think is bad!), but in the end people respond to incentives
Why VSCode
VSCode is Microsoft's open-source code editor. It supports a wide array of programming languages and comes with the usual IDE features like syntax highlighting, code completion, Copilot, and version control integration.2
More importantly, turns out that it is fairly straightforward to integrate VSCode with Stata via plug-ins. VSCode also has nice LaTeX extensions, which in my opinion makes it the only real alternative to Overleaf. This means that you can seamlessly integrate all your workflow into a single code editor, from data cleaning to drafting.
Why Quarto
Quarto is an open-source scientific and technical publishing system that allows users to create dynamic documents, slide decks, and reports in various formats from plain text files. Quarto files support multiple programming languages and can be rendered into interactive HTML documents, which allows the user to combine code execution with high-quality document production.
The main advantage of using a notebook-based interface relative to the native Stata editor is that it allows you to create and present exploratory analysis combining code, output, and text (including comments, LaTeX equations, and more), all in one convenient place.
And last but not least, Quarto outputs are beautiful.
Setup
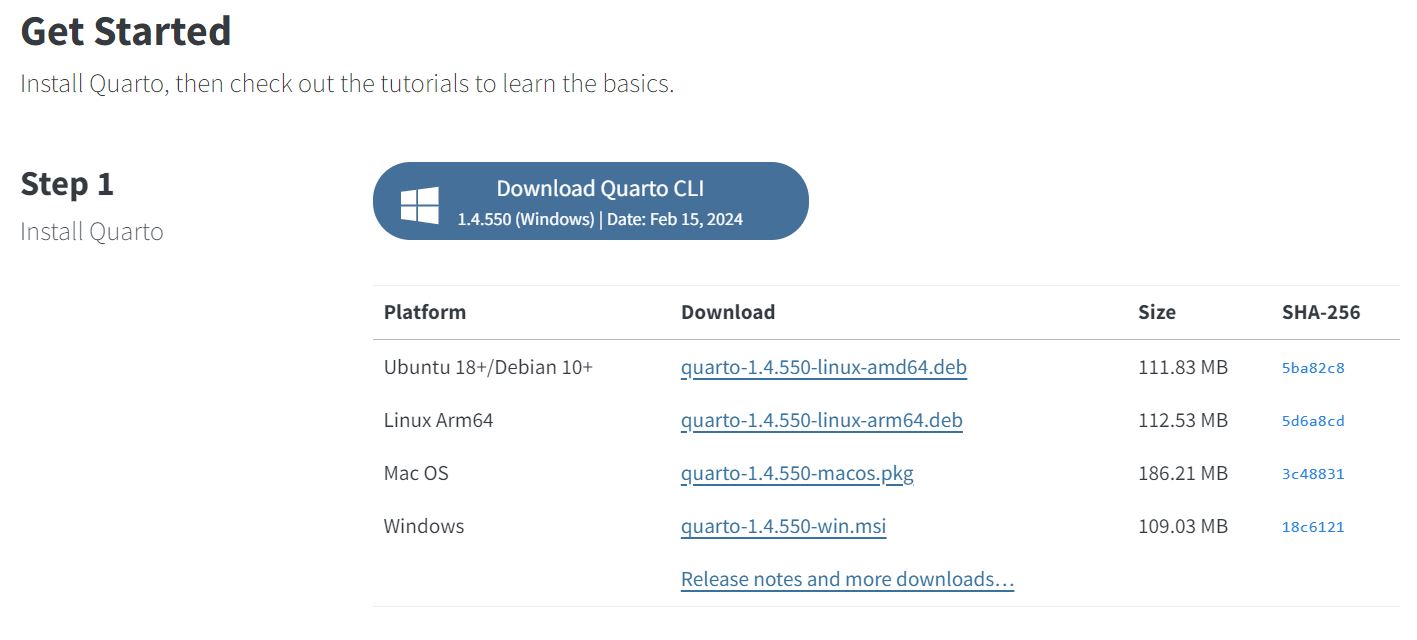
Step 1: Install Quarto
Go to https://quarto.org/, click on "Get Started", download the latest Quarto version available, and install it on your machine.
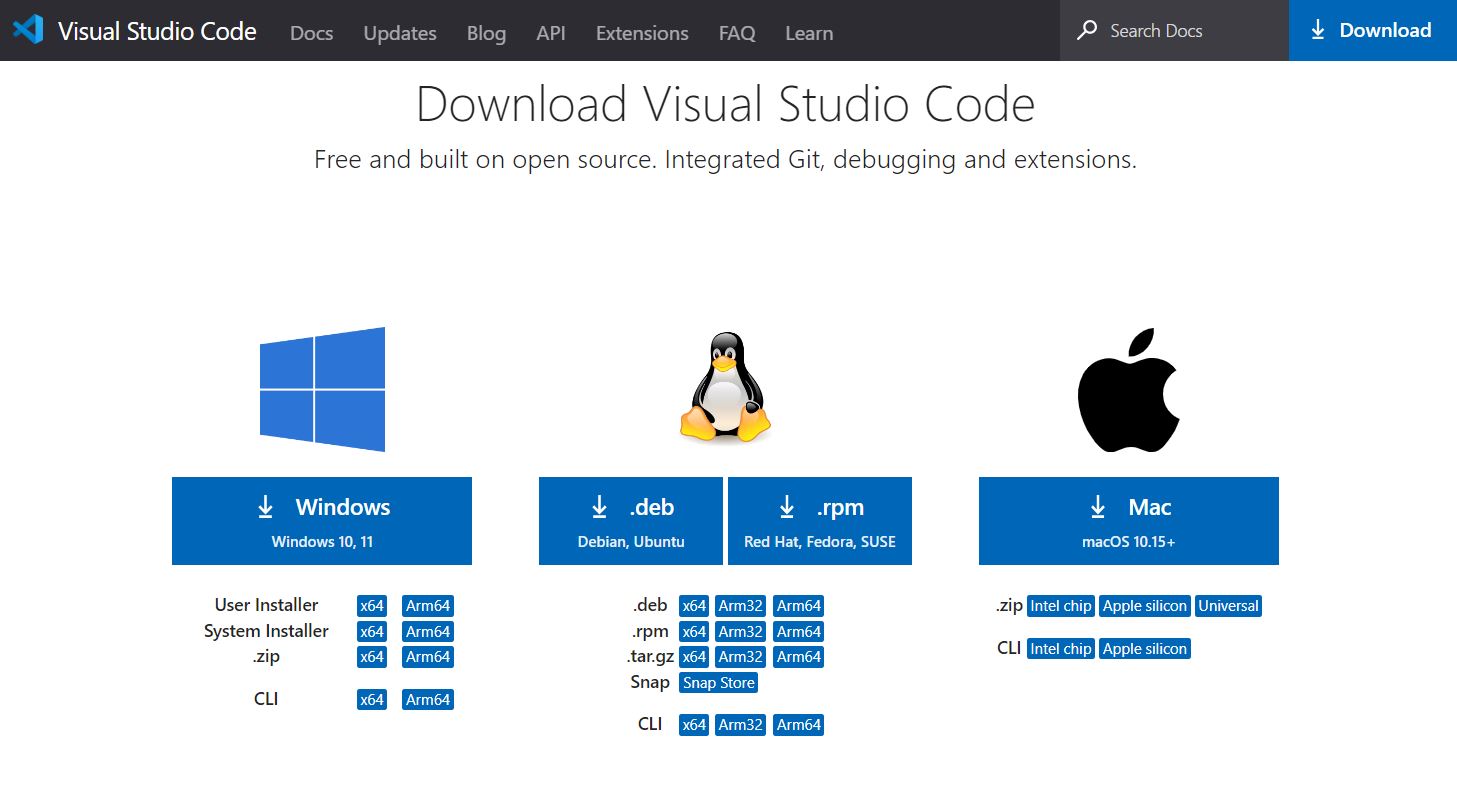
Step 2: Install VSCode
Go to https://code.visualstudio.com/download, download the latest VSCode version available, and install it on your machine.
Step 3: Install VSCode extensions
You will have to install two VSCode extensions:
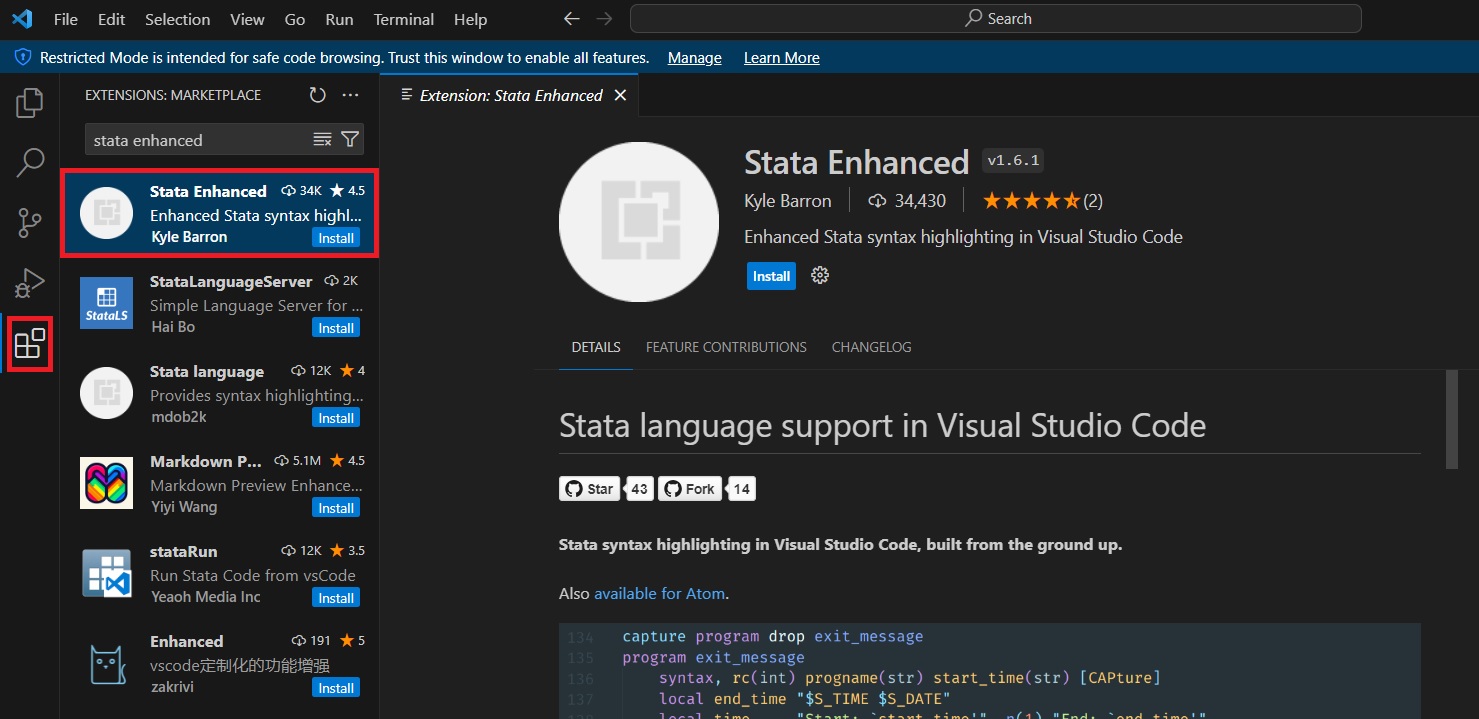
- To get nice Stata syntax highlighting and code autocompletion, you will have to install the Stata Enhanced package. Open VSCode, go to the extensions tab (highlighted in red in the screenshot), search for the extension, and install it.
- For integrated render and preview for Quarto documents, repeat the steps above and install the Quarto extension.
Step 4: Install nbstata
nbstata is a Jupyter kernel for Stata, built on top of the functionalities of the pystata Python package introduced in Stata version 17. This means that you will need Stata 17 or higher to install it.3
You can find the full user and installation guide here. For the curious, I encourage you to go through the author's guide. For the lazy ones, the short version goes as follows:
- To install
nbstata, you need an installation of Python 3.7 or higher. For first-time Python users, I would follow the suggestion from the author ofnbstataand just install the Anaconda distribution. If you want a lighter, minimalistic version, you can go for Miniconda.4 - Once you have installed Anaconda, open the Anaconda prompt and type
pip install nbstata
- Finally, install
nbstataby running
python -m nbstata.install
And that is it! Your machine should be now ready to render Quarto Markdown (.qmd) files in VSCode using the nbstata kernel.
An example
To begin, create a .qmd file. At the very start of this file, incorporate a YAML header to specify the Jupyter kernel you wish to use. In our case, to use nbstata in your Quarto document, add jupyter: nbstata within the YAML header. The YAML header is a section located at the top of Markdown files, designed to hold metadata such as configuration settings and document properties. This metadata is structured in a readable format and is essential for defining various aspects of your document's processing and presentation. A sample of YAML header could look as follows:
---
title: "Some dataviz with Stata and Quarto"
date: 2024-24-01
author: "Pablo"
jupyter: nbstata
format:
  html:
    self-contained: true
    toc: true
    toc-depth: 3
    toc-float:
      collapsed: false
      smooth-scroll: true
      width: 20%
---
You can now create code chunks as you would do in any other notebook-based interface, specifying stata in your code chunk header.
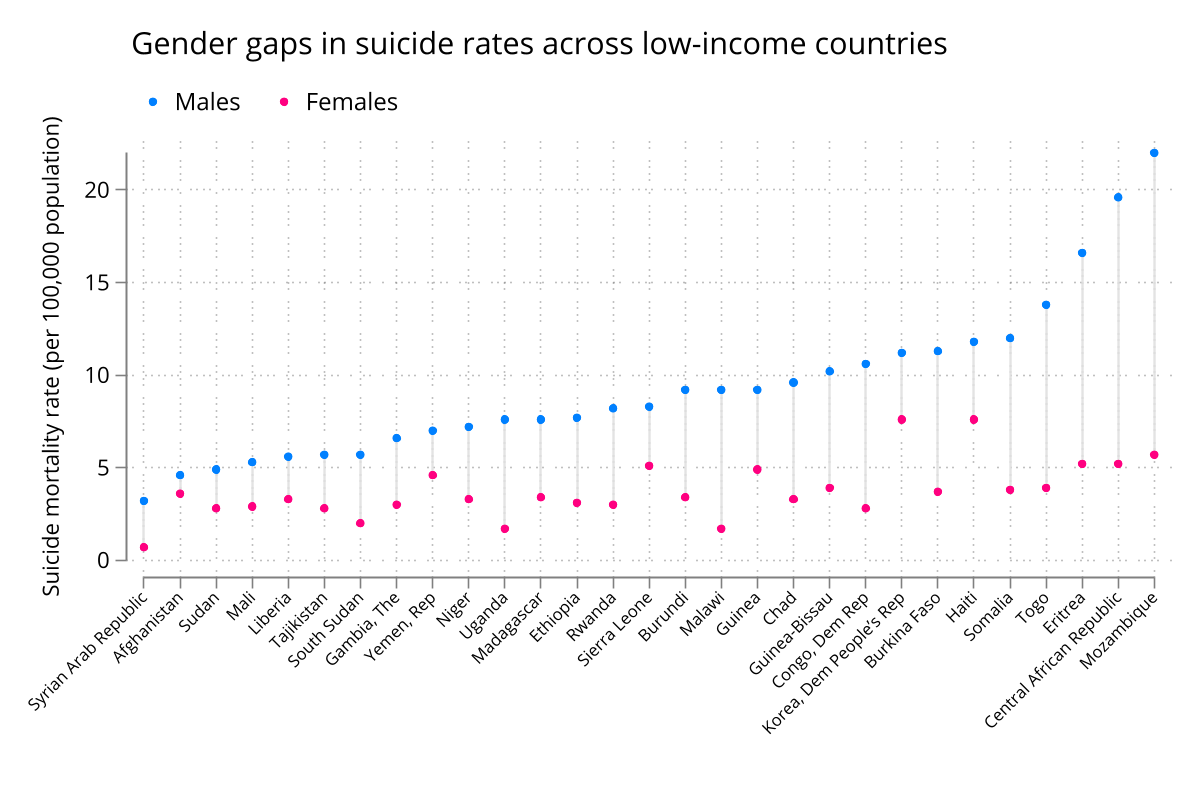
For our example, we will create a chart to visualize gender gaps in suicide rates across low-income countries. To load the dataset into our environment, we will use the Stata wrapper for the World Bank's WDI database API, wbopendata:
```{stata load-data}
wbopendata, indicator(SH.STA.SUIC.FE.P5; SH.STA.SUIC.MA.P5) clear long
desc
```
Metadata for indicator SH.STA.SUIC.FE.P5
-------------------------------------------------------------------------------
    Name: Suicide mortality rate, female (per 100,000 female population)
-------------------------------------------------------------------------------
    Collection: 2 World Development Indicators
-------------------------------------------------------------------------------
    Description: Suicide mortality rate is the number of suicide deaths in
    a year per 100,000 population. Crude suicide rate (not age-adjusted).
-------------------------------------------------------------------------------
    Note: World Health Organization, Global Health Observatory Data
    Repository (http:  apps.who.int ghodata ).
-------------------------------------------------------------------------------
    Topic(s): 8 Health
-------------------------------------------------------------------------------


    Metadata for indicator SH.STA.SUIC.MA.P5
-------------------------------------------------------------------------------
    Name: Suicide mortality rate, male (per 100,000 male population)
-------------------------------------------------------------------------------
    Collection: 2 World Development Indicators
-------------------------------------------------------------------------------
    Description: Suicide mortality rate is the number of suicide deaths in
...
sh_sta_suic_m~5 float   %8.0g                 SH.STA.SUIC.MA.P5
-------------------------------------------------------------------------------
Sorted by: countrycode  year
     Note: Dataset has changed since last saved.
Output is truncated. View as a scrollable element or open in a text editor. Adjust cell output settings...
Let's create a simple dumbbell chart by sex:
```{stata gen-chart}
* Prepare data
  cap ren sh_sta_suic_fe_p5 fem_rate
  cap ren sh_sta_suic_ma_p5 male_rate

  keep if !inlist(.,fem_rate,male_rate) // keep non-missing pairs of female and male suicide rates
  bys countrycode (year): keep if _n == _N // keep latest country-year obs.
  drop if region == "" // drop regional aggregates
  keep if incomelevelname == "Low income" // keep low-income countries

* Chart settings
  distinct countrycode
  local ub = `r(ndistinct)' // N of categories for the x-axis

  sort male_rate
  cap g order = _n // order of x-axis categories
  labmask order, val(countryname)

  su male_rate, d
  local x_max = round(r(max),0.1) // max value for y-axis

* Export chart
  #d;
  twoway (rspike male_rate fem_rate order, lcolor(gs14%90))
    (scatter male_rate order, mcolor(midblue))
    (scatter fem_rate order, mcolor(pink)),
    ytitle("Suicide mortality rate (per 100,000 population)")
    xtitle("")
    ylabel(0(5)`x_max')
    xlabel(1(1)`ub', angle(45) labsize(vsmall) valuelabel)
    legend(order(2 "Males" 3 "Females") pos(11) row(1) size(3))
    title(Gender gaps in suicide rates across low-income countries, pos(11) size(medium));
  #d cr
```
Caveats
Sadly, the integration of Stata with VSCode and Quarto is far from perfect, specially if you are used to the native Stata editor and its functionalities. Here are a couple of issues that bother me:
You will be missing the data browser and the variable explorer. This is a big one. The Stata data browser is also incredibly smooth and fast compared to the alternatives in R and Python, so it is a shame to lose one of its comparative advantages. Although
nbstatacomes with Jupyter magics that allow for browsing, such as%browsefor the main dataset and%frbrowsefor frames, so far I have not figured out a way to expand the cell output in VSCode (nor in Jupyter itself), so this is not useful. If you know of a solution, please reach out!You will not be able to change the font for your charts within VSCode. Not a big deal, you can always change it by opening Stata itself and changing the defaults with the
graph setcommands, but it is a bit annoying
Troubleshooting
In case you are finding problems with your setup, you should verify your installations and ensure that the Jupyter kernel is correctly set up and recognnized by your system.
To check if Quarto is installed and determine its version, open your command prompt (or terminal on macOS and Linux) and enter the following command:
quarto check
If Quarto is not found, ensure it is installed and that its installation directory is added to your system's PATH environment variable. Reinstalling may also help.
To verify that Python is installed on your system and to check its version, run:
python --version
To check your Python installation directory, run
where python
This command should return the version of Python installed on your system. If Python is not installed or if there are issues with the installation, this command may return an error or indicate that Python is not recognized. Similar to Quarto, ensure Python's installation directory is in your PATH. If you have multiple Python versions installed, ensure the correct version's path is prioritized.
To check which Jupyter kernels are installed on your system, use:
jupyter kernelspec list
This command will list all available kernels, including their names and installation paths. If you've installed a kernel (such as nbstata) but it doesn't appear in this list, there may be an issue with how the kernel was installed or registered with Jupyter.
Common issue: Quarto does not recognize the Python installation
If you have problems with Quarto finding the correct Python installation, you can try the following steps (here I have assumed you have installed Anaconda, but the same logic applies to Miniconda or any other Python distribution):
- Disable app execution aliases for Python: Open Settings, go to Windows Settings > Apps > Apps & features, and manage execution aliases to disable Python aliases (i.e., turn off the toggle(s) that point to the Microsoft Store app,
python.exeandpython3.exe). By disabling these, you prevent Windows from redirecting Python commands to the Microsoft Store app, allowing your system to use the Anaconda Python executable instead. - Adjusting the PATH order: go to System Properties > Advanced > Environment Variables, then select the "Path" variable under User variables or System variables and click "Edit". In the Edit Environment Variable window, find the entry for
C:\Users\[your-username]\AppData\Local\Microsoft\WindowsApps. You can either remove this entry or move it down the list so that the paths to your Anaconda installation appear above it. This changes the order in which Windows searches these paths for executable files. To check the order of your PATH environment variable, typewhere pythonin the Anaconda prompt (usually, it should be installed inC:\ProgramData\anaconda3). Then, add this path to the PATH environment variable and move it to the top of the list, adding also theScriptsfolder (usually,C:\ProgramData\anaconda3\Scripts).
Stata though has its own matrix-based programming language, Mata. Some of the most popular user-written Stata packages, like reghdfe for regressions with high dimensional fixed effects, are largely written in Mata.
For open-source languages, like R or Python, Copilot is a game-changer. For Stata, it is less useful, although I have to say that I am pleasantly surprised with the quality of its suggestions relative to ChatGPT 4.
For earlier Stata versions, an alternative would be using the stata_kernel Jupyter kernel. I have not tested it, but I have good references from colleagues. You can find the installation guide here.
nbstata is a Jupyter kernel. If you install Anaconda, you will also get JupyterLab installed, so you will be able to run Stata code from Jupyter notebooks as well. I personally hate them, but if you don't, it is an alternative.