Wellbeing I: Introduction

GDP measures everything, in short, except that which makes life worthwile
— Robert F. Kennedy
A brilliant surgeon has five patients, each in need of a different organ transplant. All five will die without these transplants, and suitable organs are not available. In the next room, there is a healthy person who came in for a routine checkup. The surgeon knows they could use this person’s organs to save the five patients. No one would ever suspect the cause of the healthy person's demise.
What should the surgeon do? Should they kill the healthy person to save the five patients?
This is a variation of the famous trolley problem, a thought experiment in ethics and moral psychology. The problem is designed to highlight the tension between two moral principles: the principle of utilitarianism, which states that the right action is the one that maximizes overall wellbeing, and the principle of deontology, which states that the right action is the one that respects individual rights and duties. In the trolley problem, the utilitarian answer is to kill the healthy person to save the five patients, while the deontological answer is to not kill the healthy person, as doing so would violate their right to life.
I am not a utilitarian. However, philosophies of justice (like liberalism) often become unhelpful in scenarios where wellbeing trade-offs are inevitable. For instance, consider now that the surgeon has healthy organs available, but only enough to save three of the five patients. What should the surgeon do in that case?
In the real world, policymakers often face decisions that entail such compromises in one way or another: for example, should we invest in a new hospital, or in a new school? Should a government implement regulations to protect consumers, which could increase the cost of goods and services and potentially stifle innovation? Should a city invest in improving public transportation, potentially reducing traffic and pollution, but at the cost of higher taxes? These are all questions that involve trade-offs between different individuals' wellbeing, and more often than not, they are not easy to answer.
One of the ultimate goals of policy should be to maximize wellbeing within constraints for the individuals that it serves to. Philosophies of justice can help us delimit those constraints, but they are not enough to guide us on how to identify wellbeing maximizing interventions and balance wellbeing trade-offs.
And this is where wellbeing research comes in.
This is the first post of a series about wellbeing measurement and policy.
Definitions
Let's start with the basics. What is wellbeing?
There is no universal definition. Wellbeing is a complex, multifaceted concept that encompasses a variety of domains, including emotional, psychological, and social aspects of life. It is also a subjective concept, meaning that it is defined by the individual's own perception of their life, rather than by an external observer. This is important to keep in mind, as it means that wellbeing is not something that can be imposed from the outside, but rather something that needs to be elicited from the individual themselves.
In the context of policy research, I like to define wellbeing as the individual's inner subjective state of satisfaction with their own existence. Nothing less, nothing more.
People often interchangeably use the idea of happiness to refer to wellbeing. I do not find this entirely accurate: happiness is a transient, momentary state of mind, while wellbeing is a more stable subjective state that factors in long-term mental and physical health, social connections, purpose, and fulfillment. However, happiness and other common wellbeing measures (such as life satisfaction) are typically highly correlated in the data, and the distinction is often blurred in practice.
One of the most common ways to elicit individual wellbeing is via large-scale household surveys. These surveys typically ask respondents to rate their own wellbeing, while at the same time collect a wide range of information about the respondent's life circumstances, such as income, employment history, health, and social relationships. Such rich data allow us to explore what are the determinants of wellbeing at the individual level, and help us to understand better how different policies and interventions would affect people's lives.
Broadly speaking, wellbeing measures can be split into three categories:
- Evaluative measures stem from asking the respondent how satisfied or happy they are with their life. A common framing is All thing considered, how satisfied/happy are you with your life nowadays?, with the answer options being either a continuous scale from 0-10 or a Likert-type scale.1 A variant of the former approach is to ask respondents to rate their life on a ladder, where the top of the ladder represents the best possible life for them, and the bottom of the ladder represents the worst possible life for them. This is commonly known as the Cantril ladder, which is used in many international household surveys such as the Gallup World Poll.
- Hedonic approaches focus on measuring how people feel at a particular point in time. This is typically done by asking respondents to report their feelings at the moment of the survey, or to recall their feelings over a specific period of time. Experienced happiness is the most common measure of hedonic wellbeing, but negative emotions such as sadness, anger, and stress are also used.
- Eudaimonic measures are based on the Aristotelian tradition with the idea that wellbeing is not just about feeling good, but also about functioning well. This approach focuses on the extent to which people are able to realize their potential, and to live a life that is meaningful and fulfilling. This is typically measured by asking respondents about their sense of purpose, their autonomy, and their relationships with others.
Tipically, evaluative and hedonic measures are the most widely used in policy research. Eudaimonic measures, although philosophically appealing, are harder to interpret – for example, when we talk about being virtuous, it is not clear whether that should be an outcome in itself or another determinant (among many) of wellbeing.
Figure 1 shows cross-country averages of life satisfaction, as measured by the Cantril ladder question from the Gallup World Poll. The figure shows that there is a wide variation in life satisfaction across countries, with the highest levels of life satisfaction being found in the Nordic countries, and the lowest levels of life satisfaction being found in sub-Saharan Africa and the Middle East. The difference between the country with the highest average life satisfaction (Finland) and the country with the lowest average life satisfaction (Afghanistan) is about 6 points on the 0-10 Cantril ladder scale.
It is (not) all about the money
Traditionally, income has been used as the main proxy for wellbeing in academic and policy circles. This is not surprising: income is relatively easy to measure, and we know that it is also good proxy for many things that directly affect wellbeing, such as higher life expectancy, better education systems, well-functioning labor markets, political stability, absence of violence...
...and wellbeing itself. Across countries, higher GDP per capita is associated with greater levels of life satisfaction. This finding is remarkably consistent across surveys, and it holds up irrespective of the definition of wellbeing we use. Figure 2 shows the relationship between GDP per capita and life satisfaction for a large number of countries, using data from the Gallup World Poll. High-income countries tend to have higher levels of life satisfaction than low-income countries, and the relationship is roughly log-linear. The latter is consistent with the idea of diminishing marginal utility of income: an extra dollar has more impact on wellbeing for the average Joe than for Jeff Bezos. Intuitive, right?
What is the catch then? Why not just stick to income as a proxy for wellbeing?
The Easterlin paradox
In 1974, economist Richard Easterlin established an empirical stylized fact:
- At a given point in time, richer people tend to be happier than poorer people, both within and across countries
- However, as income grows and countries become richer, the average level of life satisfaction in such countries does not necessarily increase
This is known as the Easterlin paradox and has been a subject of much debate in the literature. Whereas (1) is undisputedly true, (2) is more ambiguous: whereas some countries have not experienced increases in average life satisfaction despite large increases in income, others have become happier as they have climbed the income ladder.
To illustrate the Easterlin paradox, consider Figure 3, which shows the evolution of GDP per capita and average life satisfaction (derived from large-scale longitudinal household surveys) for a sample of advanced economies. The figure shows that, despite considerable increases in within-country per capita income, the average level of life satisfaction has remained surprisingly constant over time. In the U.S., for example, GDP per capita has increased by more than 500% since 1950, but people are not any happier now than they were back then.
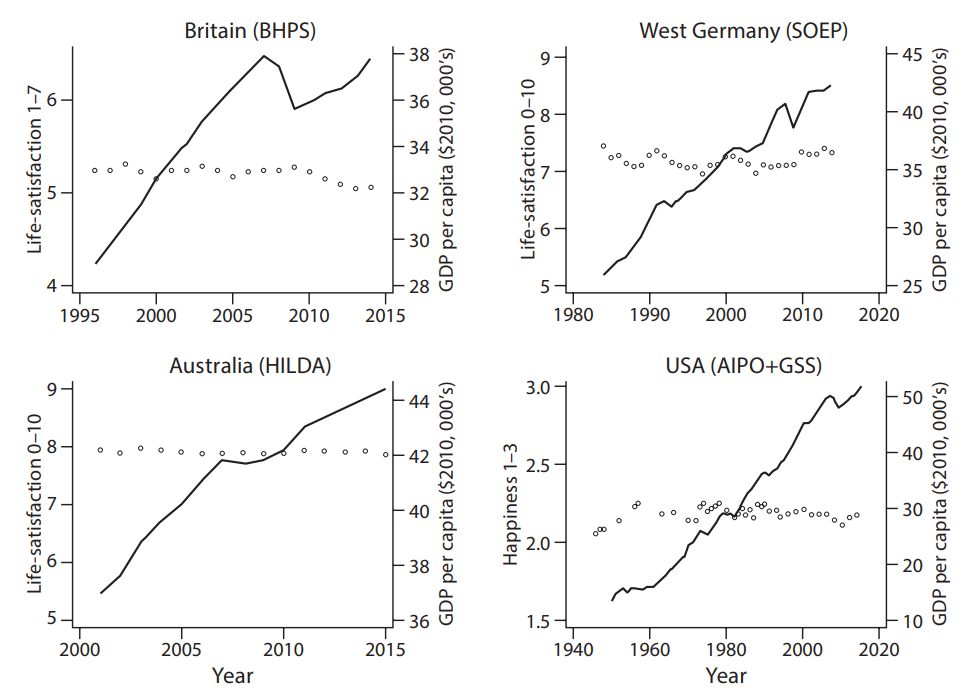
Source: Clark et al. (2018).
In light of the above, the answer to the question on why should we not rely solely on income as a proxy for wellbeing is straightforward: because it is simply not a good standalone proxy in the long-run.
The social comparison hypothesis
One of the first explanations for the paradox was that income affects wellbeing through relative, rather than absolute, terms. In other words, what matters for determining wellbeing is how one's income compares to that of others in society. This is known as the social comparison hypothesis and suggests that, if everyone becomes richer by a common factor, the average level of life satisfaction would not necessarily increase as the individuals' relative position within the income distribution would remain unchanged.
This is a very intuitive idea. If you are the only one in your social circle who has a Mercedes, you will probably feel very happy about it. But if all of a sudden all your friends start driving Ferraris, your Mercedes will now feel like a piece of junk. This is because the Mercedes serves as a status symbol: it is valuable insofar as it signals that you are in a better social position than your peers, but the moment it stops being exclusive it no longer serves that purpose.
There are a couple of interesting papers that provide evidence for the social comparison hypothesis. Card et al. (2012) run an experiment in which they randomly inform employees of the University of California about the salaries of their peers, and find that workers whose wage is below the median for their comparison group report lower job satisfaction and are more likely to start looking for a new job. Perez-Truglia (2020) exploits a natural experiment whereby Norwegian tax records became publicly available for everyone to see, and shows that income transparency increases the gap in happiness between high- and low-income individuals by 29 percent. This occurs because people at the bottom (top) of the income distribution typically overestimate (underestimate) their relative position, and increased transparency makes them realize how much worse (better) off they are compared to others.
In a less clean way, one could test for the social comparison hypothesis using a very simple regression framework in which we regress wellbeing on both individual income and the average income of a comparison group:
$$Y_i = \alpha + \beta X_i + \gamma \bar{X} + \epsilon_i$$
where $Y_i$ is individual $i$'s wellbeing, $X_i$ is individual $i$'s income, $\bar{X}$ is the average income of a group of comparators, and $\epsilon_i$ is the error term. If the relative income hypothesis holds, we would expect $\gamma$ to be negative, as individual wellbeing would decrease as the average income of the group of comparators increases.
This is exactly what we find. Table 1 shows the results of such a regression for cross-sections of different countries, in which the group of comparators is defined by people of the same sex, age group, region, and survey year, and the outcome is life satisfaction (measured on a 0-10 scale). Individual wellbeing is positively associated with individual income, but negatively associated with the average income of the comparison group. Except for the United States, a 1% increase in the average income of comparators reduces wellbeing in the same amount or more than a 1% increase in individual income increases wellbeing.
| Britain | Germany | Australia | United States | |
|---|---|---|---|---|
| Own income | 0.16 (.01) | 0.26 (.01) | 0.16 (.01) | 0.31 (.01) |
| Comparator income | -0.23 (.07) | -0.25 (.04) | -0.17 (.06) | -0.19 (.03) |
Source: Layard and De Neve (2023), Table 13.4. Standard errors in parentheses.
There are other potential explanations for the Easterlin paradox, such as the hedonic adaptation hypothesis. Roughly speaking, the idea here is that people adapt to their new income levels and their expectations increase (or decrease) accordingly. We will not discuss it in detail here, but there is equally interesting evidence on the role of adaptation in explaining the paradox.2
Effect sizes
Fine, so income growth does not necessarily lead to increases in average life satisfaction over time. But richer individuals are still happier than poorer individuals within a given cross-section. How big are the effects of income on wellbeing then? Are the people at the top of the income distribution much happier than those at the bottom?
Let's start with some raw figures. In a simple regression framework whereby we regress wellbeing on income and a set of control variables, the partial correlation coefficients would tell us that income explains about 3% of the variation in wellbeing in advanced economies. This is not zero, but it is ridiculously low for it to be the most important determinant of wellbeing (as some people have traditionally argued). It is an important factor, but certainly not the only one.
For the sake of rigor, we should look at studies with quasi-experimental designs, which exploit exogenous shocks to income (e.g., lottery prizes) to estimate the causal effect of income on wellbeing. Lindqvist et al. (2020) look at the long-run effects of lottery wealth on psychological wellbeing in Sweden, and find that an after-tax lottery prize of $100,000 increases overall life satisfaction by 0.037 standard deviations relative to the matched control group. To put it into perspective, that is about 70% of the difference in average life satisfaction between Denmark (the second happiest country in the world) and Iceland (the third happiest country in the world). In other words, this is a very small effect. Relatedly, the authors also explore the impact of lottery wealth on other outcomes, such as happiness and mental health, and in these cases the effects are not significantly different from zero. That is, lottery winners are not happier or less mentally distressed relative to the control group in the long-run.
As we saw in Figure 2, the effects of income on wellbeing are also non-linear. You probably have come across media articles arguing that, beyond a certain income threshold, the marginal effect of income on wellbeing is virtually zero. This is pretty much based on the (now sort of old) paper by Kahneman and Deaton (2010), who use data for the U.S. and find that the relationship between income and emotional wellbeing is log-linear up to an annual income of $75,000, but flattens out beyond that point. The idea is that further increases in income do not necessarily improve the individual's ability to engage in activities that are most important for their emotional wellbeing, such as spending time with friends and family, or having better health.
However, a key thing to note is that here we are looking at hedonic measures of wellbeing. Specifically, they use the average of three dicotomous, binary measures of positive affect (happiness, enjoyment, and frequent smiling and laughter) and the average of two binary measures of negative affect or "blue" states (worry and sadness). In contrast, the authors find that the relationship between income and evaluative wellbeing (i.e., what we have been referring to as life satisfaction or general happiness) shows no sign of satiation, at least to an amount over $160,000 per year.
Things got interesting when Killingsworth (2021) revisited this question and found that, conversely, hedonic wellbeing does rise with income well above the $75,000 per year threshold. The main argument of this paper is that the discrepancy with the original results might be explained by differences in the variable definitions: on top of just using binary variables (which are able to capture less variation), Kahneman and Deaton (2010) results are based on retrospective survey responses, which are subject to recall bias. Instead, Killingsworth (2021) uses large-scale real-time data collected through a smartphone app and a continuous scale to measure experienced wellbeing, finding that the latter increases linearly with log-income with no satiation point.
In a recent paper, the authors joined forces and reconciled the two previous findings (Killingsworth et al., 2023). Here, they show that the flattening pattern in the relationship between income and experienced wellbeing depicted in the original study by Kahneman and Deaton does exist, but it only applies to a limited subset of the population. Using quantile regressions, they show that increases in income do not shift upwards the bottom 15-20% of the emotional wellbeing distribution (i.e., the least happy), but they do so across all other quantiles.
To illustrate this, see Figure 4. The happiness-income gradient is positive and significant for the top 80% of the distribution, but the slope turns flat for the those below the 15th percentile after $120,000 per year.
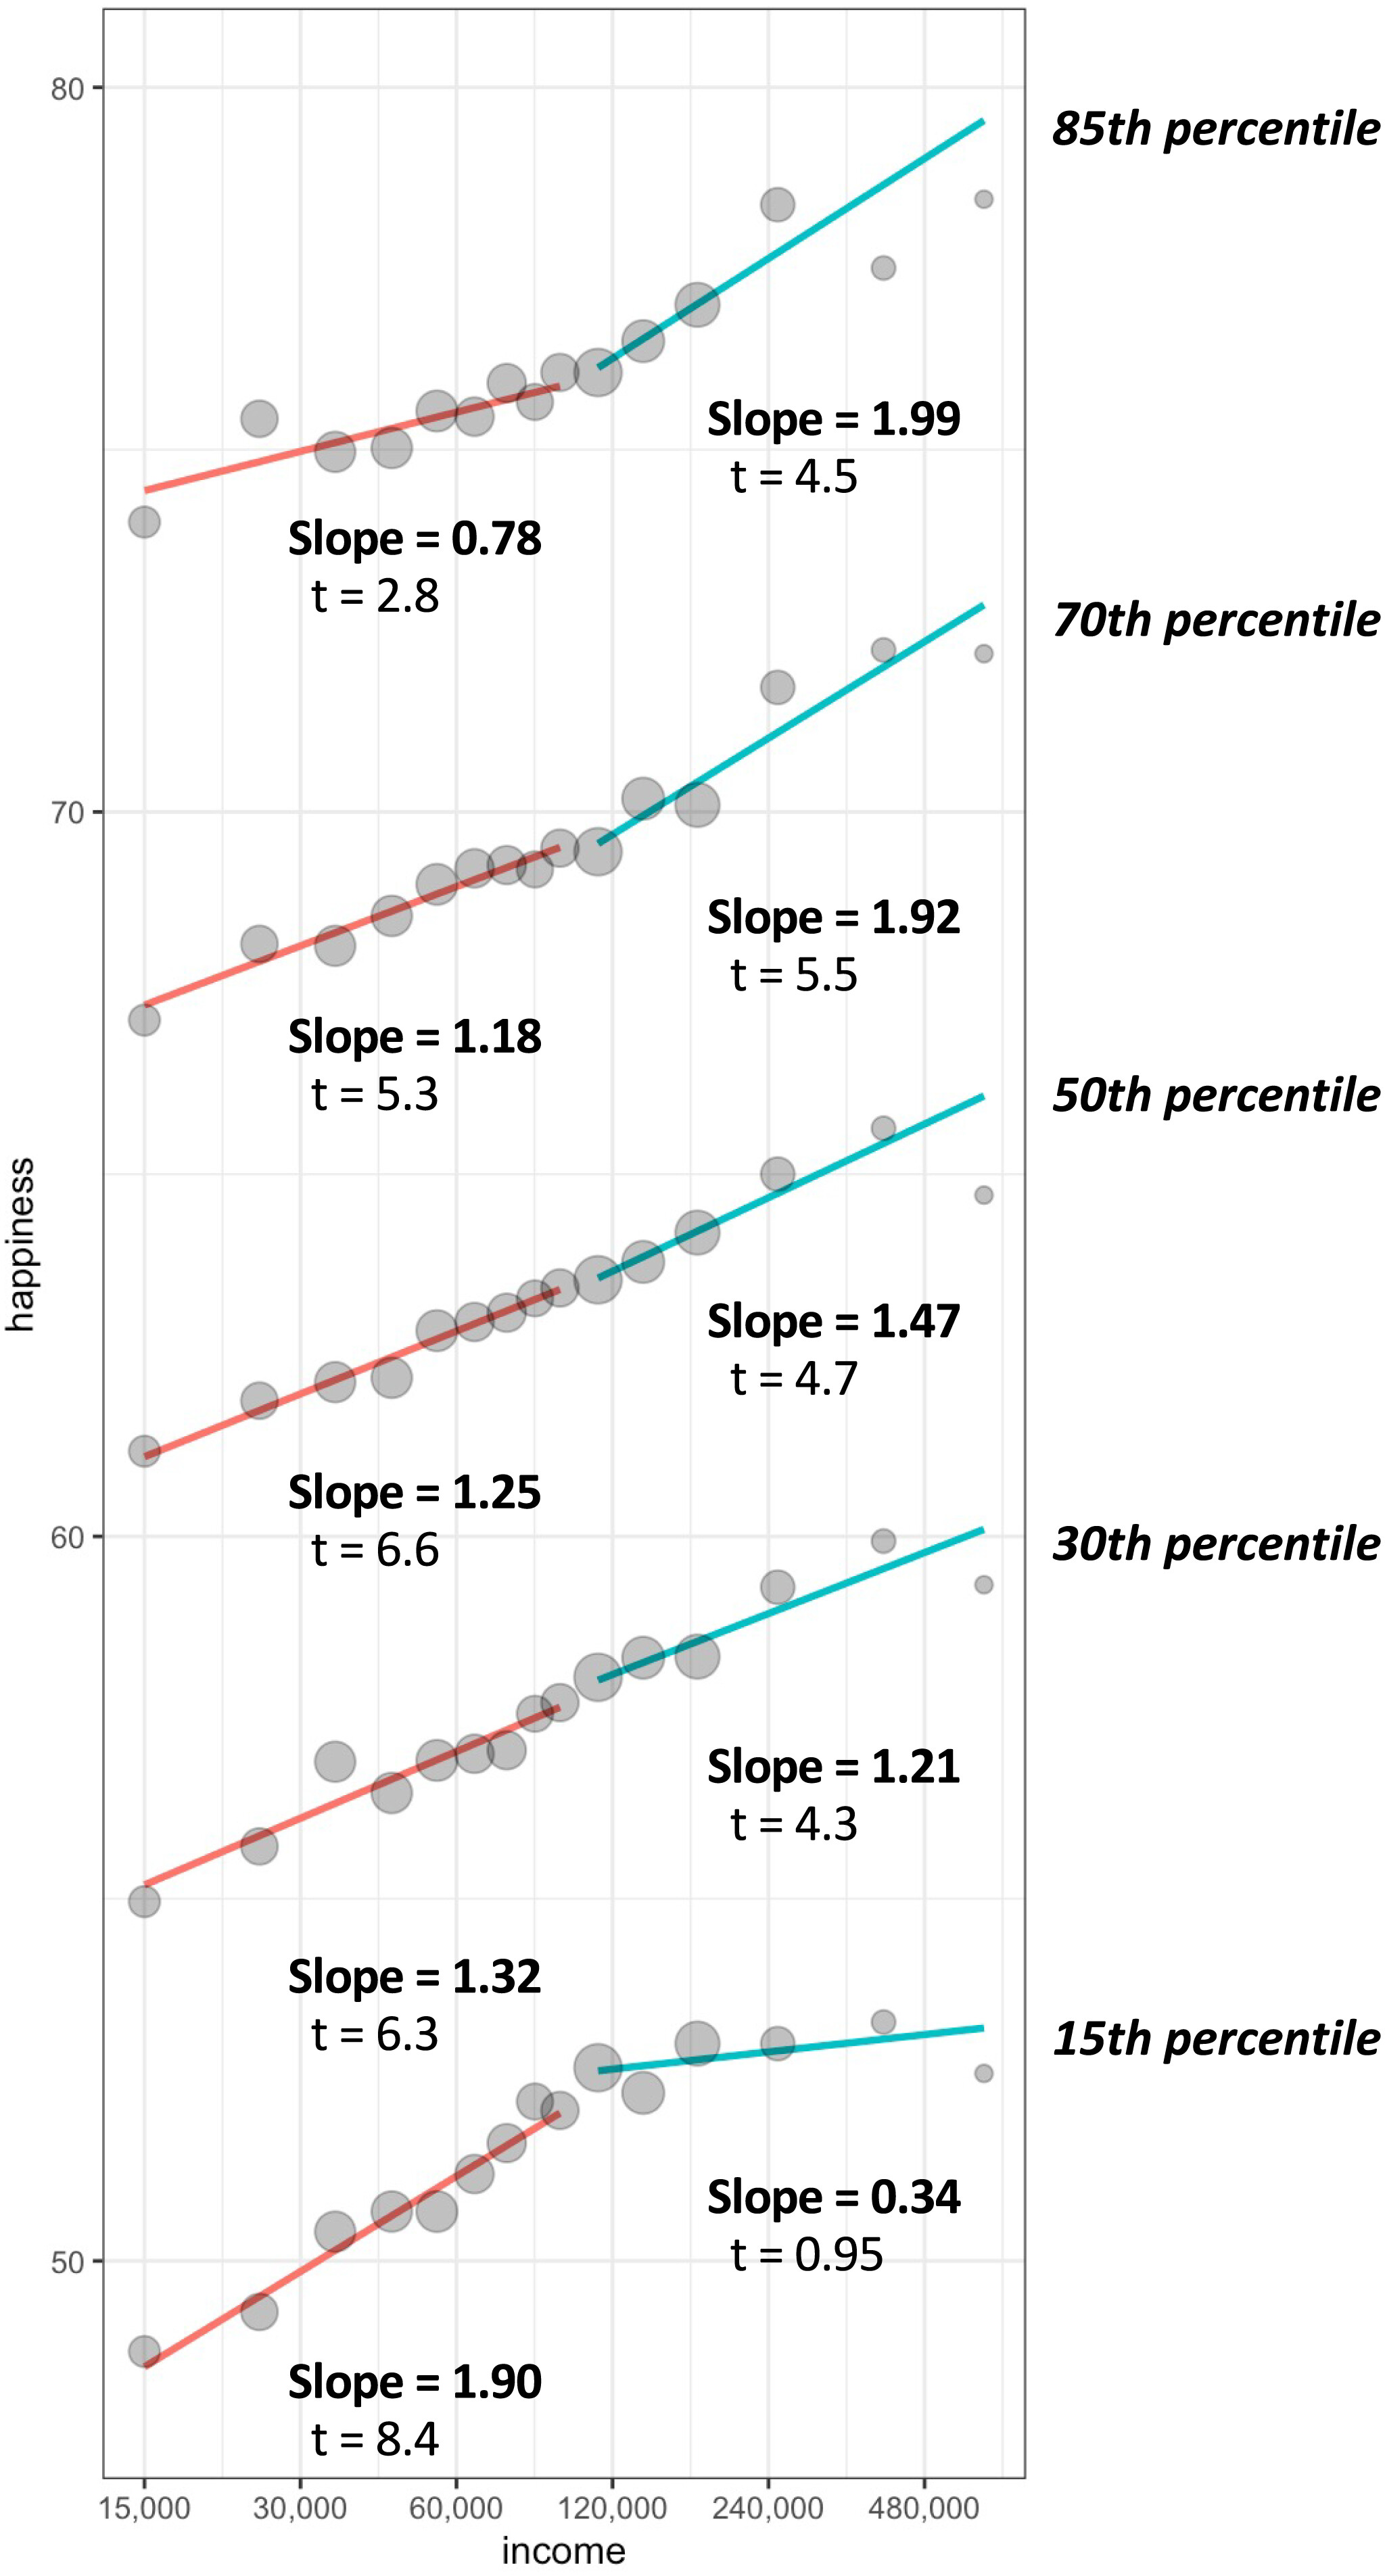
Source: Killingsworth et al. (2023).
So, why Kahneman and Deaton (2010) claimed that the satiation pattern applies to the entire population? As mentioned above, the answer is in the variable definition. Since they used dichotomous measures, the authors ended up with a very skewed distribution of happiness, especially among higher incomes, suggesting a "ceiling effect" whereby the measure could not capture differences between higher degrees of happiness. In fact, the average reported positive affect for the range of high incomes in Kahneman and Deaton (2010) is 89% of a perfect score, but we know that the happy people are not all equally happy!
To see this, consider the example of a pass-or-fail math test, consisting of questions that most students can answer correctly. This test could be informative to identify the students who are doing badly, but it would not be able to differentiate between the students who are doing well because most of them would get the same pass grade. In a sense, the measures of affect in Kahneman and Deaton (2010) are just like this test: they are good at identifying the people who are unhappy, but they have limited ability to discriminate among levels of happiness. Instead of "Happiness increases with income, but it does not further increase above $75,000 per year", it follows that the statement should have read "Unhappiness decreases with income, but it does not further decrease above $75,000 per year".
What's next?
In this post, I have briefly introduced the concept of wellbeing in the context of policy research, and disucssed the role of income in determining wellbeing. We have seen that, while income is an important driver of overall life satisfaction, its effects are typically overstated.
On a more general note, the truth is that we humans are not very good at predicting what makes us happy and fulfilled. In future posts, I will use microdata from large-scale household surveys to explore the determinants of individual wellbeing, and discuss how simple frameworks can be used to inform and design better policies (and, perhaps more importantly, to avoid bad ones).
A Likert-type scale is a psychometric scale commonly involved in research that employs questionnaires. It is the most widely used approach to scaling responses in survey research, such that the term is often used interchangeably with rating scale, although there are other types of rating scales. When responding to a Likert item, respondents specify their level of agreement or disagreement on a symmetric agree-disagree scale for a series of statements. Thus, the range captures the intensity of their feelings for a given item. For example, a 5-point Likert item could have the following options: 1. Strongly disagree, 2. Disagree, 3. Neither agree nor disagree, 4. Agree, 5. Strongly agree.
For instance, see Di Tella et al. (2010) and Kuhn et al. (2011).
References
- Blanchflower, D. G., & Bryson, A. (2023). Were Covid and the Great Recession wellbeing Reducing? IZA Discussion Paper No. 16355.
- Card, D., Mas, A., Moretti, E., & Saez, E. (2012). Inequality at Work: The Effect of Peer Salaries on Job Satisfaction. The American Economic Review, 102(6), 2981–3003. http://www.jstor.org/stable/41724678
- Di Tella, R., Haisken-De New, J., & MacCulloch, R. (2010). Happiness adaptation to income and to status in an individual panel. Journal of Economic Behavior & Organization, 76(3), 834-852. https://doi.org/10.1016/j.jebo.2010.09.016
- Easterlin, R. A., & O’Connor, K. J. (2022). Explaining happiness trends in Europe. Proceedings of the National Academy of Sciences, 119(37), e2210639119.
- Kahneman, D., & Deaton, A. (2010). High income improves evaluation of life but not emotional wellbeing. Proceedings of the national academy of sciences, 107(38), 16489-16493.
- Killingsworth, M.A. (2021). Experienced wellbeing rises with income, even above $75,000 per year. Proc. Natl. Acad. Sci. U.S.A. 118, e2016976118. https://doi.org/10.1073/pnas.2016976118
- Killingsworth, M.A., Kahneman, D., & Sellers, B. (2023). Income and emotional wellbeing: A conflict resolved. Proc. Natl. Acad. Sci. https://doi.org/10.1073/pnas.2208661120
- Kuhn, P., Kooreman, P., Soetevent, A., & Kapteyn, A. (2011). The Effects of Lottery Prizes on Winners and Their Neighbors: Evidence from the Dutch Postcode Lottery. American Economic Review, 101(5), 2226–2247. doi:10.1257/aer.101.5.2226
- Lindqvist, E., Östling, R., & Cesarini, D. (2020). Long-run effects of lottery wealth on psychological wellbeing. The Review of Economic Studies, 87(6), 2703-2726. https://doi.org/10.1093/restud/rdaa006
- Perez-Truglia, Ricardo. 2020. "The Effects of Income Transparency on wellbeing: Evidence from a Natural Experiment." American Economic Review, 110 (4): 1019-54.